Inupiat vs Immigrants from South Eastern Asia In Labor Force | Age 30-34
COMPARE
Inupiat
Immigrants from South Eastern Asia
In Labor Force | Age 30-34
In Labor Force | Age 30-34 Comparison
Inupiat
Immigrants from South Eastern Asia
79.7%
IN LABOR FORCE | AGE 30-34
0.0/ 100
METRIC RATING
333rd/ 347
METRIC RANK
84.7%
IN LABOR FORCE | AGE 30-34
54.2/ 100
METRIC RATING
167th/ 347
METRIC RANK
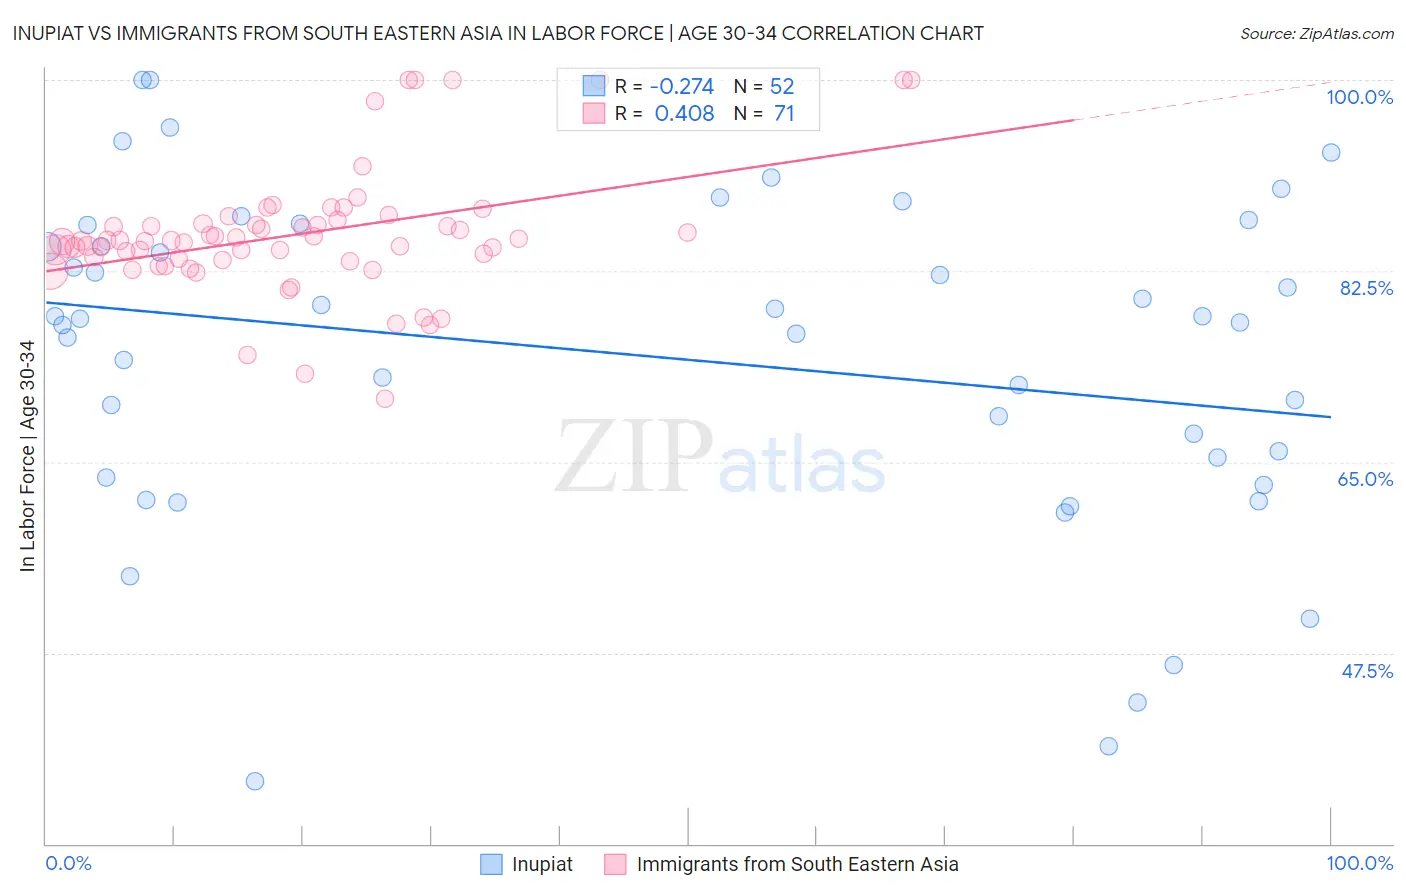
Inupiat vs Immigrants from South Eastern Asia In Labor Force | Age 30-34 Correlation Chart
The statistical analysis conducted on geographies consisting of 96,336,541 people shows a weak negative correlation between the proportion of Inupiat and labor force participation rate among population between the ages 30 and 34 in the United States with a correlation coefficient (R) of -0.274 and weighted average of 79.7%. Similarly, the statistical analysis conducted on geographies consisting of 512,225,276 people shows a moderate positive correlation between the proportion of Immigrants from South Eastern Asia and labor force participation rate among population between the ages 30 and 34 in the United States with a correlation coefficient (R) of 0.408 and weighted average of 84.7%, a difference of 6.3%.
In Labor Force | Age 30-34 Correlation Summary
| Measurement | Inupiat | Immigrants from South Eastern Asia |
| Minimum | 35.7% | 70.7% |
| Maximum | 100.0% | 100.0% |
| Range | 64.3% | 29.3% |
| Mean | 74.7% | 85.8% |
| Median | 78.0% | 85.2% |
| Interquartile 25% (IQ1) | 64.5% | 83.5% |
| Interquartile 75% (IQ3) | 85.7% | 86.9% |
| Interquartile Range (IQR) | 21.3% | 3.4% |
| Standard Deviation (Sample) | 15.1% | 5.8% |
| Standard Deviation (Population) | 15.0% | 5.8% |
Similar Demographics by In Labor Force | Age 30-34
Demographics Similar to Inupiat by In Labor Force | Age 30-34
In terms of in labor force | age 30-34, the demographic groups most similar to Inupiat are Kiowa (79.8%, a difference of 0.12%), Houma (79.9%, a difference of 0.22%), Pueblo (80.0%, a difference of 0.40%), Hopi (79.3%, a difference of 0.58%), and Marshallese (79.2%, a difference of 0.62%).
| Demographics | Rating | Rank | In Labor Force | Age 30-34 |
| Seminole | 0.0 /100 | #326 | Tragic 80.8% |
| Colville | 0.0 /100 | #327 | Tragic 80.7% |
| Sioux | 0.0 /100 | #328 | Tragic 80.4% |
| Creek | 0.0 /100 | #329 | Tragic 80.4% |
| Pueblo | 0.0 /100 | #330 | Tragic 80.0% |
| Houma | 0.0 /100 | #331 | Tragic 79.9% |
| Kiowa | 0.0 /100 | #332 | Tragic 79.8% |
| Inupiat | 0.0 /100 | #333 | Tragic 79.7% |
| Hopi | 0.0 /100 | #334 | Tragic 79.3% |
| Marshallese | 0.0 /100 | #335 | Tragic 79.2% |
| Natives/Alaskans | 0.0 /100 | #336 | Tragic 79.2% |
| Yakama | 0.0 /100 | #337 | Tragic 79.1% |
| Pima | 0.0 /100 | #338 | Tragic 79.0% |
| Apache | 0.0 /100 | #339 | Tragic 79.0% |
| Ute | 0.0 /100 | #340 | Tragic 78.9% |
Demographics Similar to Immigrants from South Eastern Asia by In Labor Force | Age 30-34
In terms of in labor force | age 30-34, the demographic groups most similar to Immigrants from South Eastern Asia are Afghan (84.7%, a difference of 0.010%), Immigrants from Peru (84.7%, a difference of 0.010%), South American Indian (84.7%, a difference of 0.010%), Immigrants from Uruguay (84.7%, a difference of 0.020%), and Icelander (84.7%, a difference of 0.020%).
| Demographics | Rating | Rank | In Labor Force | Age 30-34 |
| Pakistanis | 60.8 /100 | #160 | Good 84.7% |
| Immigrants | Cambodia | 60.7 /100 | #161 | Good 84.7% |
| South Americans | 58.7 /100 | #162 | Average 84.7% |
| Immigrants | Uruguay | 57.4 /100 | #163 | Average 84.7% |
| Icelanders | 56.8 /100 | #164 | Average 84.7% |
| Immigrants | Western Europe | 56.7 /100 | #165 | Average 84.7% |
| Afghans | 55.2 /100 | #166 | Average 84.7% |
| Immigrants | South Eastern Asia | 54.2 /100 | #167 | Average 84.7% |
| Immigrants | Peru | 52.4 /100 | #168 | Average 84.7% |
| South American Indians | 52.1 /100 | #169 | Average 84.7% |
| Immigrants | Burma/Myanmar | 52.0 /100 | #170 | Average 84.7% |
| Irish | 52.0 /100 | #171 | Average 84.7% |
| Immigrants | England | 51.7 /100 | #172 | Average 84.7% |
| Israelis | 51.1 /100 | #173 | Average 84.7% |
| Finns | 50.0 /100 | #174 | Average 84.7% |