European vs Immigrants from Syria In Labor Force | Age 30-34
COMPARE
European
Immigrants from Syria
In Labor Force | Age 30-34
In Labor Force | Age 30-34 Comparison
Europeans
Immigrants from Syria
84.3%
IN LABOR FORCE | AGE 30-34
7.2/ 100
METRIC RATING
215th/ 347
METRIC RANK
84.5%
IN LABOR FORCE | AGE 30-34
21.9/ 100
METRIC RATING
197th/ 347
METRIC RANK
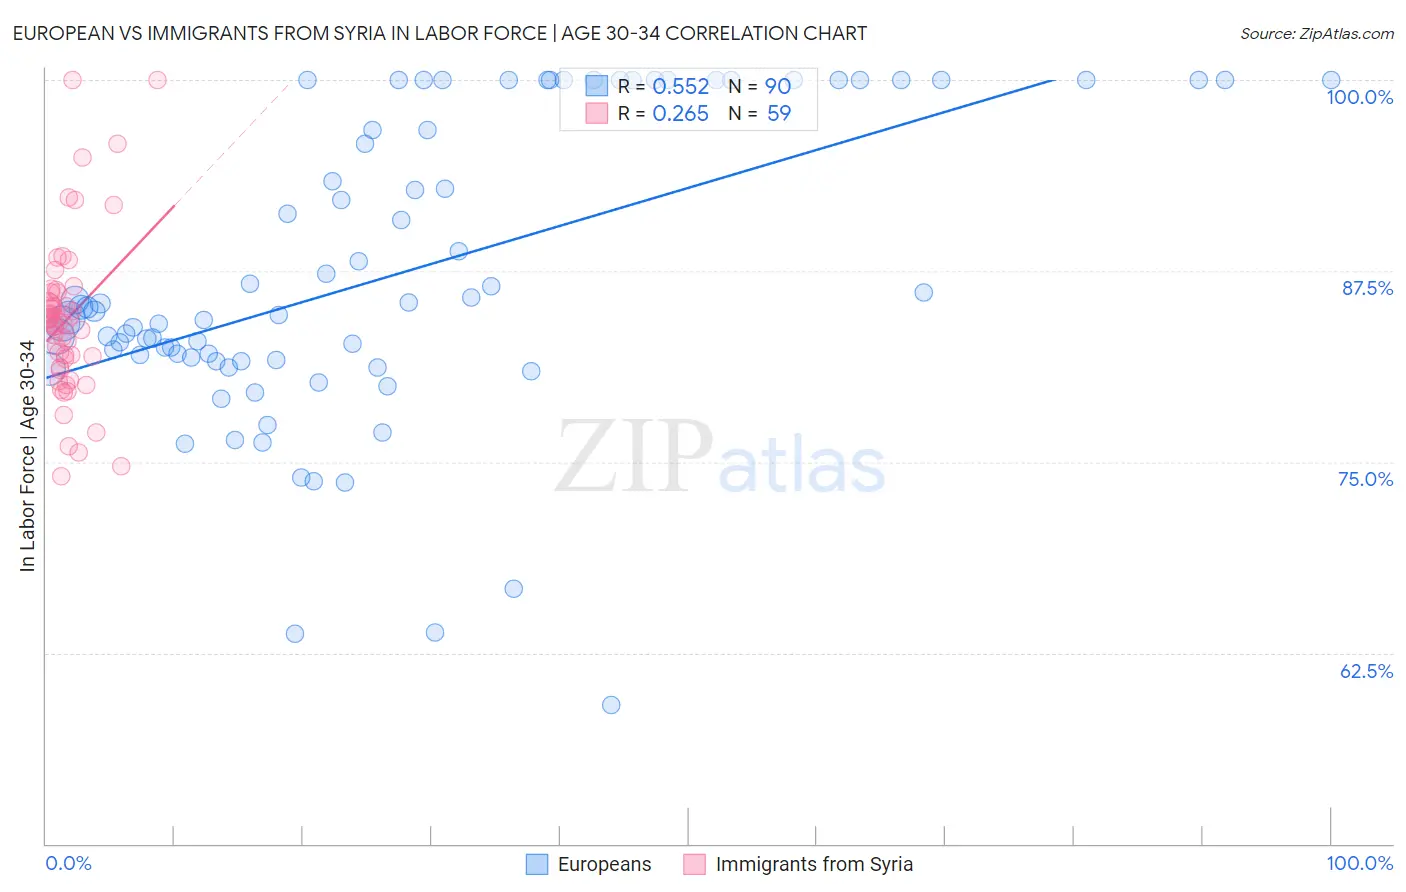
European vs Immigrants from Syria In Labor Force | Age 30-34 Correlation Chart
The statistical analysis conducted on geographies consisting of 560,760,193 people shows a substantial positive correlation between the proportion of Europeans and labor force participation rate among population between the ages 30 and 34 in the United States with a correlation coefficient (R) of 0.552 and weighted average of 84.3%. Similarly, the statistical analysis conducted on geographies consisting of 174,094,070 people shows a weak positive correlation between the proportion of Immigrants from Syria and labor force participation rate among population between the ages 30 and 34 in the United States with a correlation coefficient (R) of 0.265 and weighted average of 84.5%, a difference of 0.23%.
In Labor Force | Age 30-34 Correlation Summary
| Measurement | European | Immigrants from Syria |
| Minimum | 59.1% | 74.0% |
| Maximum | 100.0% | 100.0% |
| Range | 40.9% | 26.0% |
| Mean | 87.3% | 84.3% |
| Median | 85.0% | 84.1% |
| Interquartile 25% (IQ1) | 81.7% | 81.2% |
| Interquartile 75% (IQ3) | 100.0% | 86.1% |
| Interquartile Range (IQR) | 18.3% | 4.9% |
| Standard Deviation (Sample) | 9.8% | 5.3% |
| Standard Deviation (Population) | 9.8% | 5.3% |
Demographics Similar to Europeans and Immigrants from Syria by In Labor Force | Age 30-34
In terms of in labor force | age 30-34, the demographic groups most similar to Europeans are Immigrants from Germany (84.3%, a difference of 0.0%), Immigrants from Ecuador (84.3%, a difference of 0.0%), Immigrants from Western Asia (84.3%, a difference of 0.020%), Immigrants from Jamaica (84.3%, a difference of 0.020%), and Arab (84.3%, a difference of 0.040%). Similarly, the demographic groups most similar to Immigrants from Syria are British (84.5%, a difference of 0.010%), Dutch (84.5%, a difference of 0.020%), Immigrants from Thailand (84.5%, a difference of 0.030%), Subsaharan African (84.5%, a difference of 0.030%), and Trinidadian and Tobagonian (84.5%, a difference of 0.040%).
| Demographics | Rating | Rank | In Labor Force | Age 30-34 |
| British | 22.9 /100 | #196 | Fair 84.5% |
| Immigrants | Syria | 21.9 /100 | #197 | Fair 84.5% |
| Dutch | 20.2 /100 | #198 | Fair 84.5% |
| Immigrants | Thailand | 19.1 /100 | #199 | Poor 84.5% |
| Sub-Saharan Africans | 19.0 /100 | #200 | Poor 84.5% |
| Trinidadians and Tobagonians | 18.2 /100 | #201 | Poor 84.5% |
| Immigrants | West Indies | 18.1 /100 | #202 | Poor 84.5% |
| Canadians | 15.4 /100 | #203 | Poor 84.4% |
| Ecuadorians | 14.2 /100 | #204 | Poor 84.4% |
| French | 13.8 /100 | #205 | Poor 84.4% |
| Lebanese | 10.6 /100 | #206 | Poor 84.4% |
| Bangladeshis | 9.4 /100 | #207 | Tragic 84.3% |
| Arabs | 8.9 /100 | #208 | Tragic 84.3% |
| Jamaicans | 8.8 /100 | #209 | Tragic 84.3% |
| Indonesians | 8.8 /100 | #210 | Tragic 84.3% |
| Japanese | 8.8 /100 | #211 | Tragic 84.3% |
| Immigrants | Western Asia | 8.2 /100 | #212 | Tragic 84.3% |
| Immigrants | Jamaica | 7.9 /100 | #213 | Tragic 84.3% |
| Immigrants | Germany | 7.2 /100 | #214 | Tragic 84.3% |
| Europeans | 7.2 /100 | #215 | Tragic 84.3% |
| Immigrants | Ecuador | 7.1 /100 | #216 | Tragic 84.3% |