Immigrants from France vs Immigrants from Syria In Labor Force | Age 30-34
COMPARE
Immigrants from France
Immigrants from Syria
In Labor Force | Age 30-34
In Labor Force | Age 30-34 Comparison
Immigrants from France
Immigrants from Syria
85.5%
IN LABOR FORCE | AGE 30-34
99.5/ 100
METRIC RATING
60th/ 347
METRIC RANK
84.5%
IN LABOR FORCE | AGE 30-34
21.9/ 100
METRIC RATING
197th/ 347
METRIC RANK
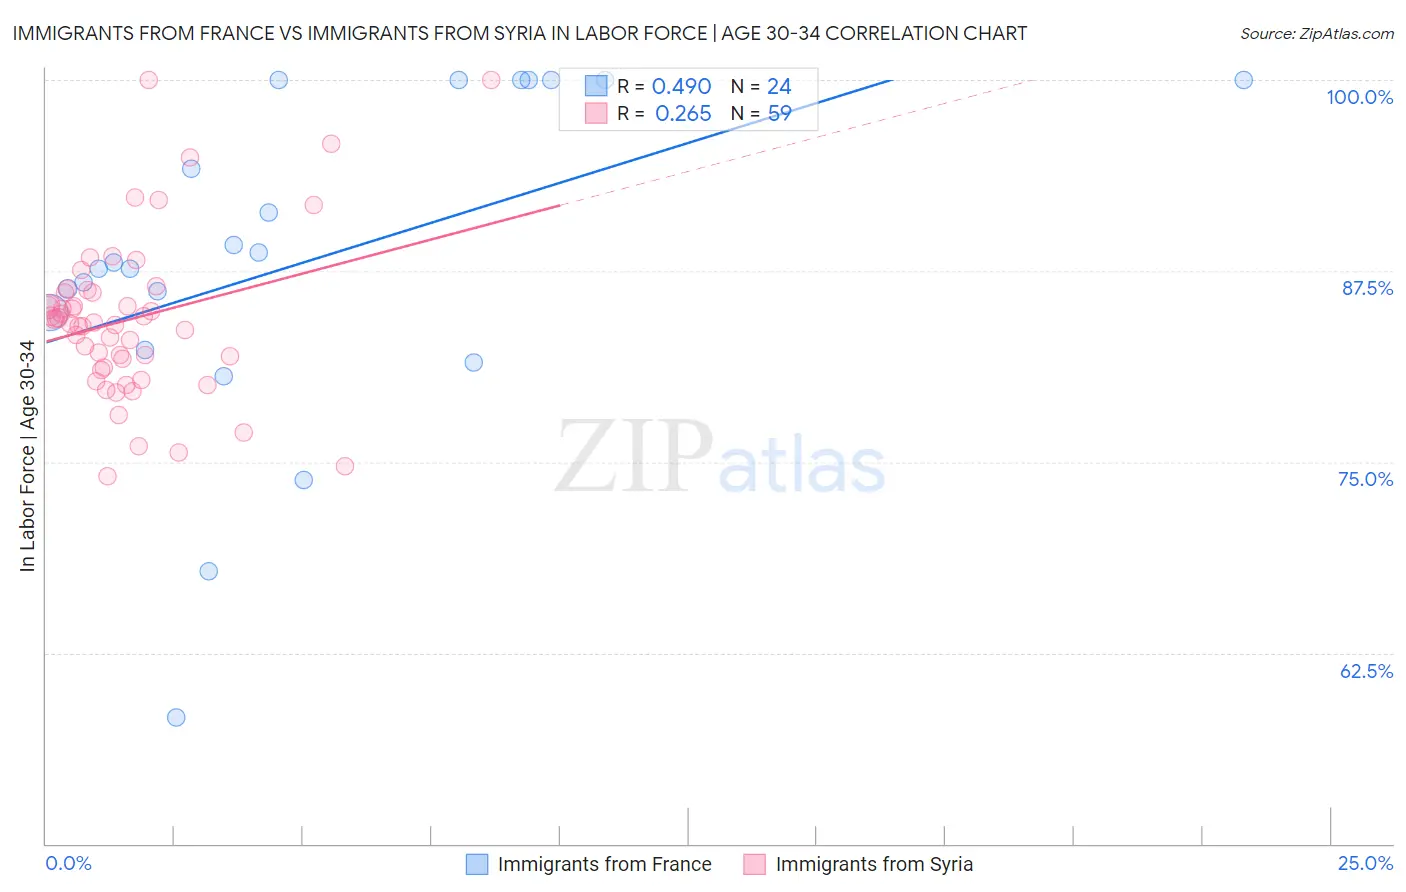
Immigrants from France vs Immigrants from Syria In Labor Force | Age 30-34 Correlation Chart
The statistical analysis conducted on geographies consisting of 287,830,684 people shows a moderate positive correlation between the proportion of Immigrants from France and labor force participation rate among population between the ages 30 and 34 in the United States with a correlation coefficient (R) of 0.490 and weighted average of 85.5%. Similarly, the statistical analysis conducted on geographies consisting of 174,094,070 people shows a weak positive correlation between the proportion of Immigrants from Syria and labor force participation rate among population between the ages 30 and 34 in the United States with a correlation coefficient (R) of 0.265 and weighted average of 84.5%, a difference of 1.1%.
In Labor Force | Age 30-34 Correlation Summary
| Measurement | Immigrants from France | Immigrants from Syria |
| Minimum | 58.2% | 74.0% |
| Maximum | 100.0% | 100.0% |
| Range | 41.8% | 26.0% |
| Mean | 88.1% | 84.3% |
| Median | 87.9% | 84.1% |
| Interquartile 25% (IQ1) | 83.6% | 81.2% |
| Interquartile 75% (IQ3) | 100.0% | 86.1% |
| Interquartile Range (IQR) | 16.4% | 4.9% |
| Standard Deviation (Sample) | 10.8% | 5.3% |
| Standard Deviation (Population) | 10.6% | 5.3% |
Similar Demographics by In Labor Force | Age 30-34
Demographics Similar to Immigrants from France by In Labor Force | Age 30-34
In terms of in labor force | age 30-34, the demographic groups most similar to Immigrants from France are Immigrants from Brazil (85.5%, a difference of 0.0%), Soviet Union (85.5%, a difference of 0.010%), Macedonian (85.5%, a difference of 0.010%), Immigrants from Poland (85.5%, a difference of 0.020%), and Italian (85.4%, a difference of 0.020%).
| Demographics | Rating | Rank | In Labor Force | Age 30-34 |
| Filipinos | 99.6 /100 | #53 | Exceptional 85.5% |
| Immigrants | Kenya | 99.6 /100 | #54 | Exceptional 85.5% |
| Immigrants | Turkey | 99.6 /100 | #55 | Exceptional 85.5% |
| Czechs | 99.6 /100 | #56 | Exceptional 85.5% |
| Russians | 99.6 /100 | #57 | Exceptional 85.5% |
| Poles | 99.6 /100 | #58 | Exceptional 85.5% |
| Immigrants | Poland | 99.5 /100 | #59 | Exceptional 85.5% |
| Immigrants | France | 99.5 /100 | #60 | Exceptional 85.5% |
| Immigrants | Brazil | 99.5 /100 | #61 | Exceptional 85.5% |
| Soviet Union | 99.4 /100 | #62 | Exceptional 85.5% |
| Macedonians | 99.4 /100 | #63 | Exceptional 85.5% |
| Italians | 99.4 /100 | #64 | Exceptional 85.4% |
| Senegalese | 99.4 /100 | #65 | Exceptional 85.4% |
| Ghanaians | 99.4 /100 | #66 | Exceptional 85.4% |
| Kenyans | 99.3 /100 | #67 | Exceptional 85.4% |
Demographics Similar to Immigrants from Syria by In Labor Force | Age 30-34
In terms of in labor force | age 30-34, the demographic groups most similar to Immigrants from Syria are Korean (84.5%, a difference of 0.010%), British (84.5%, a difference of 0.010%), Immigrants from Costa Rica (84.5%, a difference of 0.020%), Immigrants from Afghanistan (84.5%, a difference of 0.020%), and Dutch (84.5%, a difference of 0.020%).
| Demographics | Rating | Rank | In Labor Force | Age 30-34 |
| Immigrants | Zaire | 25.8 /100 | #190 | Fair 84.5% |
| Hungarians | 24.8 /100 | #191 | Fair 84.5% |
| Scandinavians | 24.7 /100 | #192 | Fair 84.5% |
| Immigrants | Costa Rica | 23.9 /100 | #193 | Fair 84.5% |
| Immigrants | Afghanistan | 23.5 /100 | #194 | Fair 84.5% |
| Koreans | 23.2 /100 | #195 | Fair 84.5% |
| British | 22.9 /100 | #196 | Fair 84.5% |
| Immigrants | Syria | 21.9 /100 | #197 | Fair 84.5% |
| Dutch | 20.2 /100 | #198 | Fair 84.5% |
| Immigrants | Thailand | 19.1 /100 | #199 | Poor 84.5% |
| Sub-Saharan Africans | 19.0 /100 | #200 | Poor 84.5% |
| Trinidadians and Tobagonians | 18.2 /100 | #201 | Poor 84.5% |
| Immigrants | West Indies | 18.1 /100 | #202 | Poor 84.5% |
| Canadians | 15.4 /100 | #203 | Poor 84.4% |
| Ecuadorians | 14.2 /100 | #204 | Poor 84.4% |