German vs Immigrants from Syria In Labor Force | Age 30-34
COMPARE
German
Immigrants from Syria
In Labor Force | Age 30-34
In Labor Force | Age 30-34 Comparison
Germans
Immigrants from Syria
84.8%
IN LABOR FORCE | AGE 30-34
75.1/ 100
METRIC RATING
150th/ 347
METRIC RANK
84.5%
IN LABOR FORCE | AGE 30-34
21.9/ 100
METRIC RATING
197th/ 347
METRIC RANK
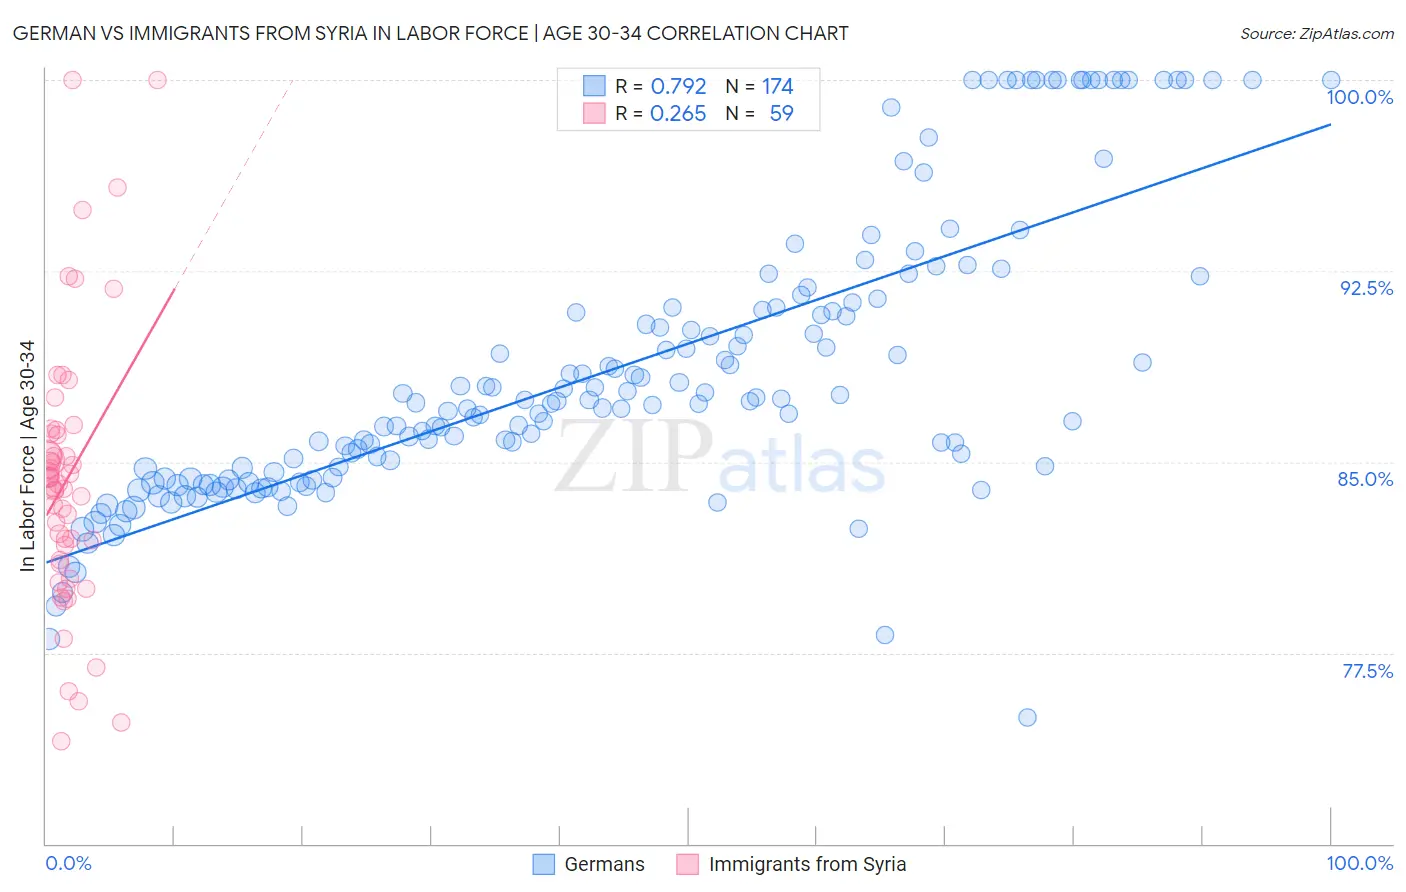
German vs Immigrants from Syria In Labor Force | Age 30-34 Correlation Chart
The statistical analysis conducted on geographies consisting of 579,117,313 people shows a strong positive correlation between the proportion of Germans and labor force participation rate among population between the ages 30 and 34 in the United States with a correlation coefficient (R) of 0.792 and weighted average of 84.8%. Similarly, the statistical analysis conducted on geographies consisting of 174,094,070 people shows a weak positive correlation between the proportion of Immigrants from Syria and labor force participation rate among population between the ages 30 and 34 in the United States with a correlation coefficient (R) of 0.265 and weighted average of 84.5%, a difference of 0.42%.
In Labor Force | Age 30-34 Correlation Summary
| Measurement | German | Immigrants from Syria |
| Minimum | 75.0% | 74.0% |
| Maximum | 100.0% | 100.0% |
| Range | 25.0% | 26.0% |
| Mean | 88.6% | 84.3% |
| Median | 87.3% | 84.1% |
| Interquartile 25% (IQ1) | 84.4% | 81.2% |
| Interquartile 75% (IQ3) | 91.0% | 86.1% |
| Interquartile Range (IQR) | 6.7% | 4.9% |
| Standard Deviation (Sample) | 5.6% | 5.3% |
| Standard Deviation (Population) | 5.6% | 5.3% |
Similar Demographics by In Labor Force | Age 30-34
Demographics Similar to Germans by In Labor Force | Age 30-34
In terms of in labor force | age 30-34, the demographic groups most similar to Germans are Immigrants from Ukraine (84.8%, a difference of 0.0%), Immigrants from Saudi Arabia (84.9%, a difference of 0.010%), Immigrants from Colombia (84.9%, a difference of 0.010%), Immigrants from Pakistan (84.9%, a difference of 0.010%), and Immigrants from Senegal (84.8%, a difference of 0.010%).
| Demographics | Rating | Rank | In Labor Force | Age 30-34 |
| Colombians | 82.2 /100 | #143 | Excellent 84.9% |
| Uruguayans | 78.5 /100 | #144 | Good 84.9% |
| Palestinians | 77.7 /100 | #145 | Good 84.9% |
| Immigrants | Saudi Arabia | 76.6 /100 | #146 | Good 84.9% |
| Immigrants | Colombia | 76.3 /100 | #147 | Good 84.9% |
| Immigrants | Pakistan | 76.2 /100 | #148 | Good 84.9% |
| Immigrants | Ukraine | 75.1 /100 | #149 | Good 84.8% |
| Germans | 75.1 /100 | #150 | Good 84.8% |
| Immigrants | Senegal | 74.0 /100 | #151 | Good 84.8% |
| Romanians | 73.5 /100 | #152 | Good 84.8% |
| Syrians | 70.1 /100 | #153 | Good 84.8% |
| Northern Europeans | 70.0 /100 | #154 | Good 84.8% |
| Immigrants | Sudan | 69.5 /100 | #155 | Good 84.8% |
| French Canadians | 67.3 /100 | #156 | Good 84.8% |
| Peruvians | 65.9 /100 | #157 | Good 84.8% |
Demographics Similar to Immigrants from Syria by In Labor Force | Age 30-34
In terms of in labor force | age 30-34, the demographic groups most similar to Immigrants from Syria are Korean (84.5%, a difference of 0.010%), British (84.5%, a difference of 0.010%), Immigrants from Costa Rica (84.5%, a difference of 0.020%), Immigrants from Afghanistan (84.5%, a difference of 0.020%), and Dutch (84.5%, a difference of 0.020%).
| Demographics | Rating | Rank | In Labor Force | Age 30-34 |
| Immigrants | Zaire | 25.8 /100 | #190 | Fair 84.5% |
| Hungarians | 24.8 /100 | #191 | Fair 84.5% |
| Scandinavians | 24.7 /100 | #192 | Fair 84.5% |
| Immigrants | Costa Rica | 23.9 /100 | #193 | Fair 84.5% |
| Immigrants | Afghanistan | 23.5 /100 | #194 | Fair 84.5% |
| Koreans | 23.2 /100 | #195 | Fair 84.5% |
| British | 22.9 /100 | #196 | Fair 84.5% |
| Immigrants | Syria | 21.9 /100 | #197 | Fair 84.5% |
| Dutch | 20.2 /100 | #198 | Fair 84.5% |
| Immigrants | Thailand | 19.1 /100 | #199 | Poor 84.5% |
| Sub-Saharan Africans | 19.0 /100 | #200 | Poor 84.5% |
| Trinidadians and Tobagonians | 18.2 /100 | #201 | Poor 84.5% |
| Immigrants | West Indies | 18.1 /100 | #202 | Poor 84.5% |
| Canadians | 15.4 /100 | #203 | Poor 84.4% |
| Ecuadorians | 14.2 /100 | #204 | Poor 84.4% |