Inupiat vs Greek In Labor Force | Age 30-34
COMPARE
Inupiat
Greek
In Labor Force | Age 30-34
In Labor Force | Age 30-34 Comparison
Inupiat
Greeks
79.7%
IN LABOR FORCE | AGE 30-34
0.0/ 100
METRIC RATING
333rd/ 347
METRIC RANK
85.3%
IN LABOR FORCE | AGE 30-34
98.6/ 100
METRIC RATING
84th/ 347
METRIC RANK
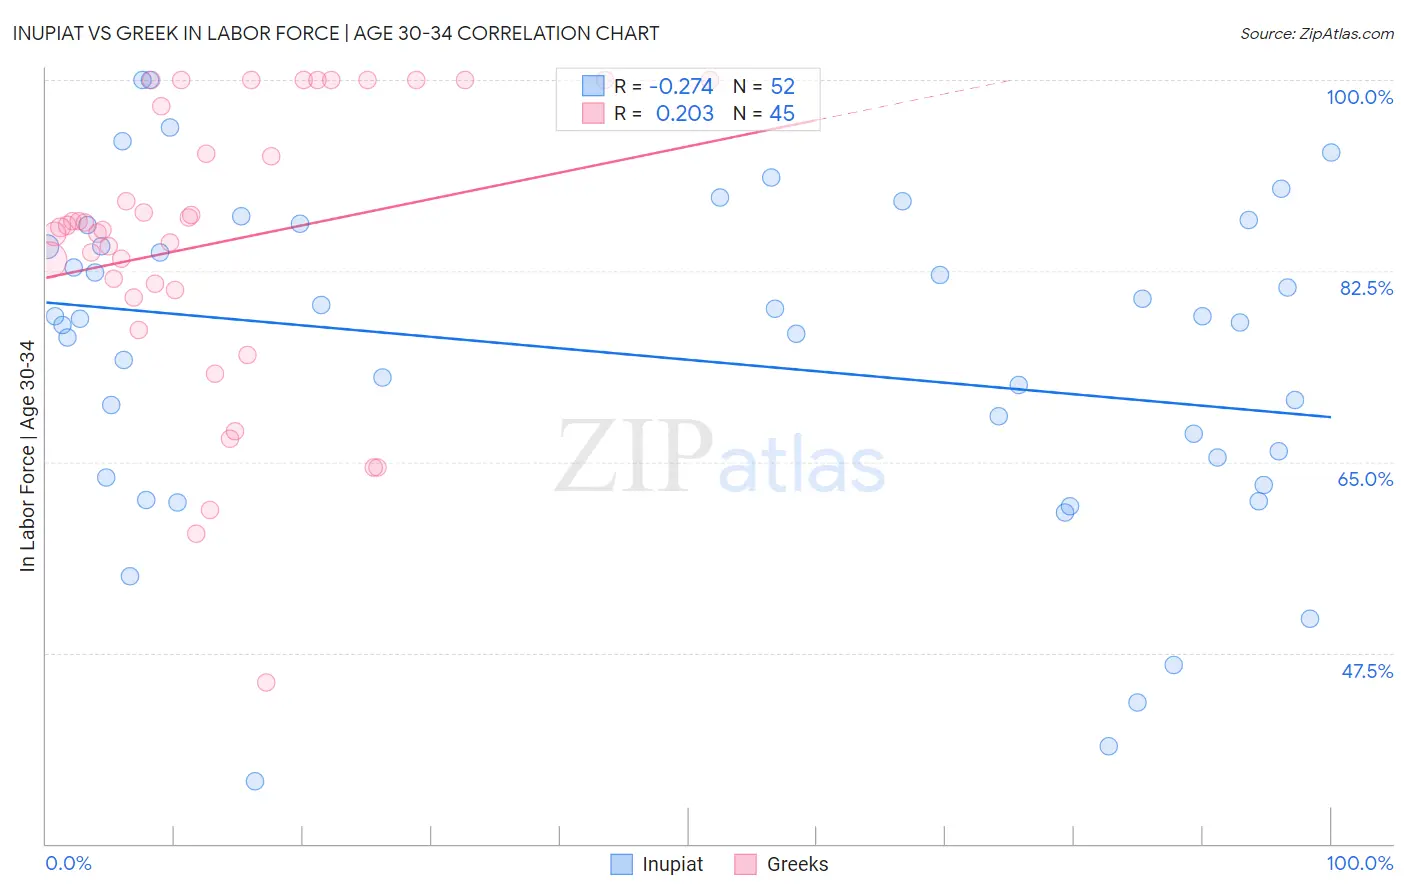
Inupiat vs Greek In Labor Force | Age 30-34 Correlation Chart
The statistical analysis conducted on geographies consisting of 96,336,541 people shows a weak negative correlation between the proportion of Inupiat and labor force participation rate among population between the ages 30 and 34 in the United States with a correlation coefficient (R) of -0.274 and weighted average of 79.7%. Similarly, the statistical analysis conducted on geographies consisting of 482,259,585 people shows a weak positive correlation between the proportion of Greeks and labor force participation rate among population between the ages 30 and 34 in the United States with a correlation coefficient (R) of 0.203 and weighted average of 85.3%, a difference of 7.0%.
In Labor Force | Age 30-34 Correlation Summary
| Measurement | Inupiat | Greek |
| Minimum | 35.7% | 44.8% |
| Maximum | 100.0% | 100.0% |
| Range | 64.3% | 55.2% |
| Mean | 74.7% | 85.0% |
| Median | 78.0% | 86.5% |
| Interquartile 25% (IQ1) | 64.5% | 80.4% |
| Interquartile 75% (IQ3) | 85.7% | 98.8% |
| Interquartile Range (IQR) | 21.3% | 18.4% |
| Standard Deviation (Sample) | 15.1% | 13.1% |
| Standard Deviation (Population) | 15.0% | 13.0% |
Similar Demographics by In Labor Force | Age 30-34
Demographics Similar to Inupiat by In Labor Force | Age 30-34
In terms of in labor force | age 30-34, the demographic groups most similar to Inupiat are Kiowa (79.8%, a difference of 0.12%), Houma (79.9%, a difference of 0.22%), Pueblo (80.0%, a difference of 0.40%), Hopi (79.3%, a difference of 0.58%), and Marshallese (79.2%, a difference of 0.62%).
| Demographics | Rating | Rank | In Labor Force | Age 30-34 |
| Seminole | 0.0 /100 | #326 | Tragic 80.8% |
| Colville | 0.0 /100 | #327 | Tragic 80.7% |
| Sioux | 0.0 /100 | #328 | Tragic 80.4% |
| Creek | 0.0 /100 | #329 | Tragic 80.4% |
| Pueblo | 0.0 /100 | #330 | Tragic 80.0% |
| Houma | 0.0 /100 | #331 | Tragic 79.9% |
| Kiowa | 0.0 /100 | #332 | Tragic 79.8% |
| Inupiat | 0.0 /100 | #333 | Tragic 79.7% |
| Hopi | 0.0 /100 | #334 | Tragic 79.3% |
| Marshallese | 0.0 /100 | #335 | Tragic 79.2% |
| Natives/Alaskans | 0.0 /100 | #336 | Tragic 79.2% |
| Yakama | 0.0 /100 | #337 | Tragic 79.1% |
| Pima | 0.0 /100 | #338 | Tragic 79.0% |
| Apache | 0.0 /100 | #339 | Tragic 79.0% |
| Ute | 0.0 /100 | #340 | Tragic 78.9% |
Demographics Similar to Greeks by In Labor Force | Age 30-34
In terms of in labor force | age 30-34, the demographic groups most similar to Greeks are Immigrants from Europe (85.3%, a difference of 0.0%), Slovak (85.3%, a difference of 0.010%), Immigrants from Africa (85.3%, a difference of 0.010%), Mongolian (85.3%, a difference of 0.010%), and Immigrants from Switzerland (85.3%, a difference of 0.020%).
| Demographics | Rating | Rank | In Labor Force | Age 30-34 |
| Immigrants | Eastern Asia | 98.9 /100 | #77 | Exceptional 85.4% |
| Immigrants | Singapore | 98.8 /100 | #78 | Exceptional 85.3% |
| Immigrants | Switzerland | 98.7 /100 | #79 | Exceptional 85.3% |
| Immigrants | Russia | 98.7 /100 | #80 | Exceptional 85.3% |
| Slovaks | 98.7 /100 | #81 | Exceptional 85.3% |
| Immigrants | Africa | 98.6 /100 | #82 | Exceptional 85.3% |
| Immigrants | Europe | 98.6 /100 | #83 | Exceptional 85.3% |
| Greeks | 98.6 /100 | #84 | Exceptional 85.3% |
| Mongolians | 98.5 /100 | #85 | Exceptional 85.3% |
| Immigrants | Taiwan | 98.3 /100 | #86 | Exceptional 85.3% |
| Immigrants | Northern Europe | 98.2 /100 | #87 | Exceptional 85.3% |
| Immigrants | Belgium | 98.2 /100 | #88 | Exceptional 85.3% |
| Immigrants | Kazakhstan | 98.1 /100 | #89 | Exceptional 85.3% |
| Burmese | 97.9 /100 | #90 | Exceptional 85.3% |
| Immigrants | Moldova | 97.9 /100 | #91 | Exceptional 85.3% |