Indonesian vs Immigrants from Costa Rica In Labor Force | Age 16-19
COMPARE
Indonesian
Immigrants from Costa Rica
In Labor Force | Age 16-19
In Labor Force | Age 16-19 Comparison
Indonesians
Immigrants from Costa Rica
40.7%
IN LABOR FORCE | AGE 16-19
100.0/ 100
METRIC RATING
50th/ 347
METRIC RANK
35.6%
IN LABOR FORCE | AGE 16-19
10.7/ 100
METRIC RATING
217th/ 347
METRIC RANK
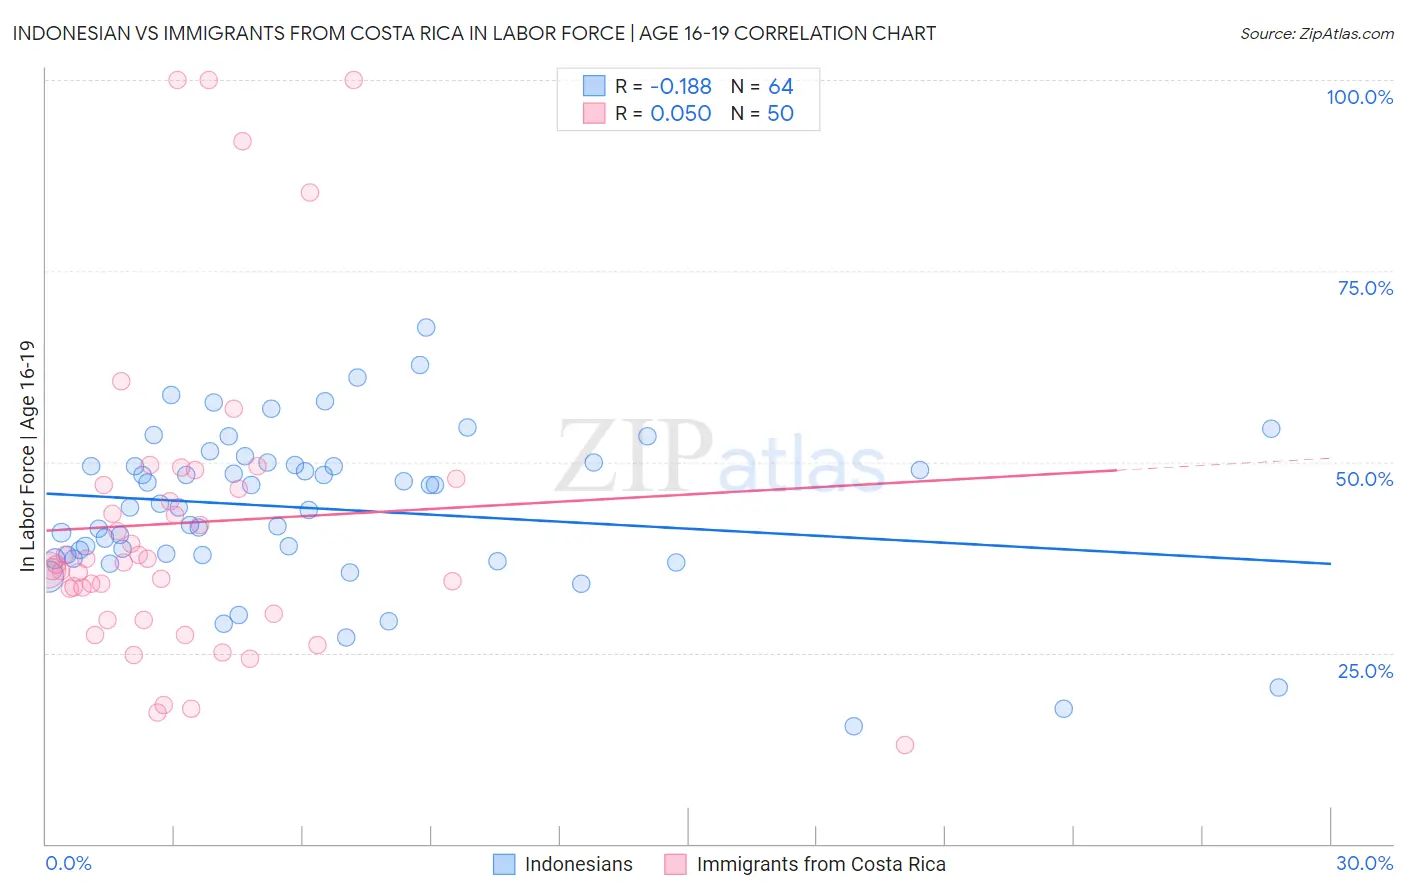
Indonesian vs Immigrants from Costa Rica In Labor Force | Age 16-19 Correlation Chart
The statistical analysis conducted on geographies consisting of 162,704,149 people shows a poor negative correlation between the proportion of Indonesians and labor force participation rate among population between the ages 16 and 19 in the United States with a correlation coefficient (R) of -0.188 and weighted average of 40.7%. Similarly, the statistical analysis conducted on geographies consisting of 204,218,033 people shows a slight positive correlation between the proportion of Immigrants from Costa Rica and labor force participation rate among population between the ages 16 and 19 in the United States with a correlation coefficient (R) of 0.050 and weighted average of 35.6%, a difference of 14.4%.
In Labor Force | Age 16-19 Correlation Summary
| Measurement | Indonesian | Immigrants from Costa Rica |
| Minimum | 15.4% | 13.0% |
| Maximum | 67.6% | 100.0% |
| Range | 52.2% | 87.0% |
| Mean | 43.9% | 42.0% |
| Median | 44.3% | 36.7% |
| Interquartile 25% (IQ1) | 37.8% | 30.1% |
| Interquartile 75% (IQ3) | 49.8% | 46.9% |
| Interquartile Range (IQR) | 11.9% | 16.9% |
| Standard Deviation (Sample) | 10.3% | 20.6% |
| Standard Deviation (Population) | 10.2% | 20.4% |
Similar Demographics by In Labor Force | Age 16-19
Demographics Similar to Indonesians by In Labor Force | Age 16-19
In terms of in labor force | age 16-19, the demographic groups most similar to Indonesians are Immigrants from Zaire (40.7%, a difference of 0.10%), Cree (40.8%, a difference of 0.16%), Icelander (40.8%, a difference of 0.18%), Immigrants from Laos (40.6%, a difference of 0.19%), and Carpatho Rusyn (40.8%, a difference of 0.23%).
| Demographics | Rating | Rank | In Labor Force | Age 16-19 |
| Tongans | 100.0 /100 | #43 | Exceptional 41.2% |
| Europeans | 100.0 /100 | #44 | Exceptional 41.1% |
| Croatians | 100.0 /100 | #45 | Exceptional 41.1% |
| Immigrants | Sudan | 100.0 /100 | #46 | Exceptional 41.0% |
| Carpatho Rusyns | 100.0 /100 | #47 | Exceptional 40.8% |
| Icelanders | 100.0 /100 | #48 | Exceptional 40.8% |
| Cree | 100.0 /100 | #49 | Exceptional 40.8% |
| Indonesians | 100.0 /100 | #50 | Exceptional 40.7% |
| Immigrants | Zaire | 100.0 /100 | #51 | Exceptional 40.7% |
| Immigrants | Laos | 100.0 /100 | #52 | Exceptional 40.6% |
| Immigrants | Kenya | 100.0 /100 | #53 | Exceptional 40.5% |
| Tlingit-Haida | 100.0 /100 | #54 | Exceptional 40.5% |
| British | 100.0 /100 | #55 | Exceptional 40.5% |
| Fijians | 100.0 /100 | #56 | Exceptional 40.4% |
| Lithuanians | 100.0 /100 | #57 | Exceptional 40.4% |
Demographics Similar to Immigrants from Costa Rica by In Labor Force | Age 16-19
In terms of in labor force | age 16-19, the demographic groups most similar to Immigrants from Costa Rica are Dutch West Indian (35.6%, a difference of 0.0%), Immigrants from South Eastern Asia (35.6%, a difference of 0.020%), Apache (35.6%, a difference of 0.040%), Houma (35.6%, a difference of 0.050%), and Immigrants from Bolivia (35.6%, a difference of 0.050%).
| Demographics | Rating | Rank | In Labor Force | Age 16-19 |
| Immigrants | Switzerland | 11.9 /100 | #210 | Poor 35.6% |
| Mexicans | 11.9 /100 | #211 | Poor 35.6% |
| Houma | 11.0 /100 | #212 | Poor 35.6% |
| Immigrants | Bolivia | 11.0 /100 | #213 | Poor 35.6% |
| Apache | 11.0 /100 | #214 | Poor 35.6% |
| Immigrants | South Eastern Asia | 10.8 /100 | #215 | Poor 35.6% |
| Dutch West Indians | 10.7 /100 | #216 | Poor 35.6% |
| Immigrants | Costa Rica | 10.7 /100 | #217 | Poor 35.6% |
| Sri Lankans | 9.8 /100 | #218 | Tragic 35.5% |
| Guatemalans | 8.6 /100 | #219 | Tragic 35.5% |
| Immigrants | Bahamas | 8.3 /100 | #220 | Tragic 35.5% |
| Turks | 7.3 /100 | #221 | Tragic 35.4% |
| Immigrants | Ghana | 7.3 /100 | #222 | Tragic 35.4% |
| Ghanaians | 6.5 /100 | #223 | Tragic 35.3% |
| Hondurans | 6.5 /100 | #224 | Tragic 35.3% |