Indonesian vs Senegalese In Labor Force | Age 16-19
COMPARE
Indonesian
Senegalese
In Labor Force | Age 16-19
In Labor Force | Age 16-19 Comparison
Indonesians
Senegalese
40.7%
IN LABOR FORCE | AGE 16-19
100.0/ 100
METRIC RATING
50th/ 347
METRIC RANK
35.9%
IN LABOR FORCE | AGE 16-19
17.4/ 100
METRIC RATING
202nd/ 347
METRIC RANK
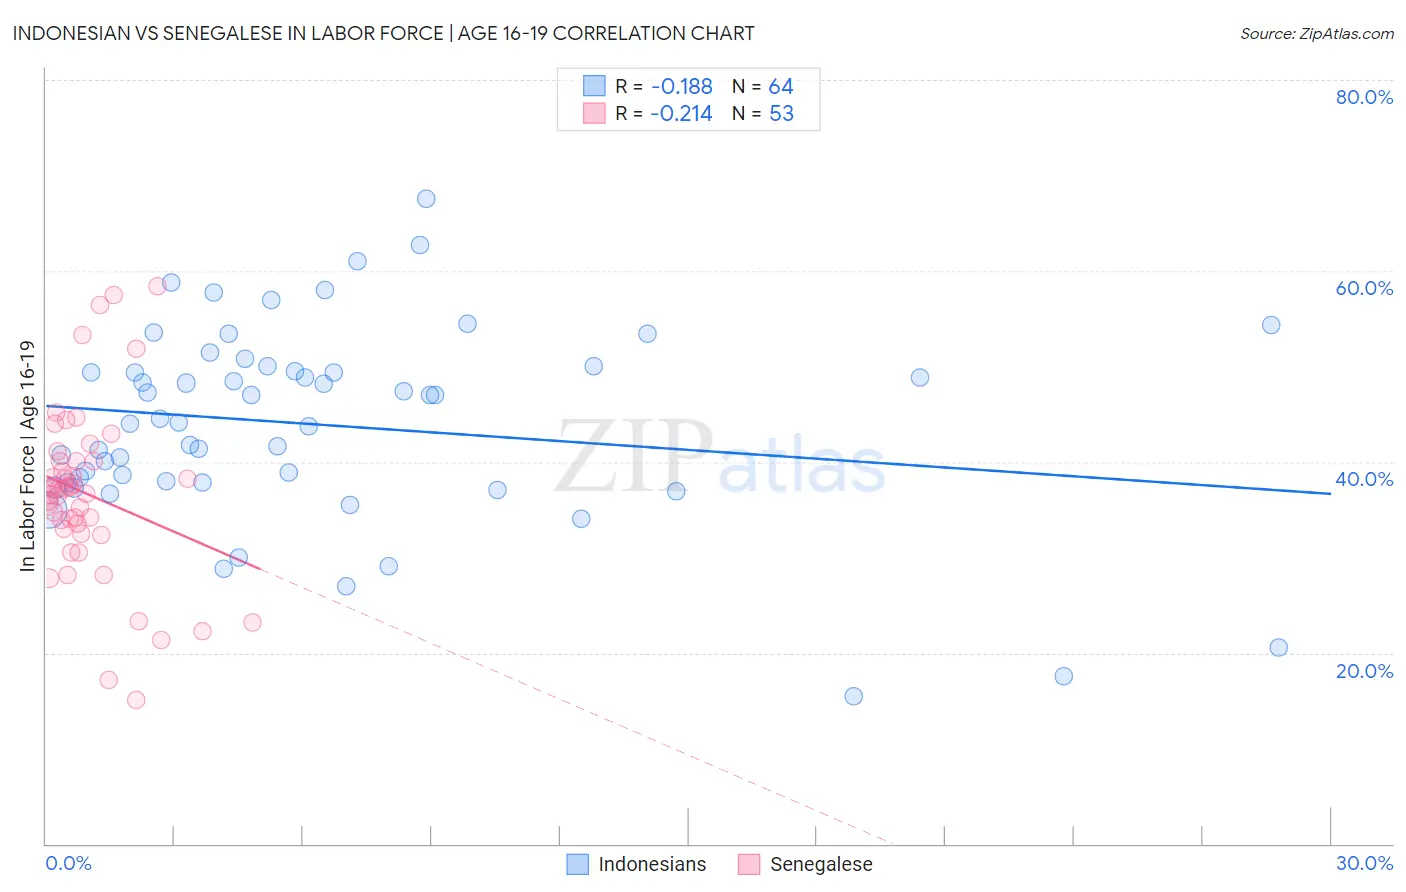
Indonesian vs Senegalese In Labor Force | Age 16-19 Correlation Chart
The statistical analysis conducted on geographies consisting of 162,704,149 people shows a poor negative correlation between the proportion of Indonesians and labor force participation rate among population between the ages 16 and 19 in the United States with a correlation coefficient (R) of -0.188 and weighted average of 40.7%. Similarly, the statistical analysis conducted on geographies consisting of 78,118,537 people shows a weak negative correlation between the proportion of Senegalese and labor force participation rate among population between the ages 16 and 19 in the United States with a correlation coefficient (R) of -0.214 and weighted average of 35.9%, a difference of 13.5%.
In Labor Force | Age 16-19 Correlation Summary
| Measurement | Indonesian | Senegalese |
| Minimum | 15.4% | 15.0% |
| Maximum | 67.6% | 58.4% |
| Range | 52.2% | 43.4% |
| Mean | 43.9% | 36.6% |
| Median | 44.3% | 37.2% |
| Interquartile 25% (IQ1) | 37.8% | 32.7% |
| Interquartile 75% (IQ3) | 49.8% | 40.1% |
| Interquartile Range (IQR) | 11.9% | 7.4% |
| Standard Deviation (Sample) | 10.3% | 9.0% |
| Standard Deviation (Population) | 10.2% | 8.9% |
Similar Demographics by In Labor Force | Age 16-19
Demographics Similar to Indonesians by In Labor Force | Age 16-19
In terms of in labor force | age 16-19, the demographic groups most similar to Indonesians are Immigrants from Zaire (40.7%, a difference of 0.10%), Cree (40.8%, a difference of 0.16%), Icelander (40.8%, a difference of 0.18%), Immigrants from Laos (40.6%, a difference of 0.19%), and Carpatho Rusyn (40.8%, a difference of 0.23%).
| Demographics | Rating | Rank | In Labor Force | Age 16-19 |
| Tongans | 100.0 /100 | #43 | Exceptional 41.2% |
| Europeans | 100.0 /100 | #44 | Exceptional 41.1% |
| Croatians | 100.0 /100 | #45 | Exceptional 41.1% |
| Immigrants | Sudan | 100.0 /100 | #46 | Exceptional 41.0% |
| Carpatho Rusyns | 100.0 /100 | #47 | Exceptional 40.8% |
| Icelanders | 100.0 /100 | #48 | Exceptional 40.8% |
| Cree | 100.0 /100 | #49 | Exceptional 40.8% |
| Indonesians | 100.0 /100 | #50 | Exceptional 40.7% |
| Immigrants | Zaire | 100.0 /100 | #51 | Exceptional 40.7% |
| Immigrants | Laos | 100.0 /100 | #52 | Exceptional 40.6% |
| Immigrants | Kenya | 100.0 /100 | #53 | Exceptional 40.5% |
| Tlingit-Haida | 100.0 /100 | #54 | Exceptional 40.5% |
| British | 100.0 /100 | #55 | Exceptional 40.5% |
| Fijians | 100.0 /100 | #56 | Exceptional 40.4% |
| Lithuanians | 100.0 /100 | #57 | Exceptional 40.4% |
Demographics Similar to Senegalese by In Labor Force | Age 16-19
In terms of in labor force | age 16-19, the demographic groups most similar to Senegalese are Alsatian (35.9%, a difference of 0.010%), Immigrants from Nigeria (35.8%, a difference of 0.060%), Immigrants from Sweden (35.9%, a difference of 0.12%), Immigrants from Norway (35.9%, a difference of 0.20%), and Immigrants from Northern Africa (35.9%, a difference of 0.21%).
| Demographics | Rating | Rank | In Labor Force | Age 16-19 |
| Bolivians | 23.3 /100 | #195 | Fair 36.0% |
| Mexican American Indians | 21.1 /100 | #196 | Fair 36.0% |
| Immigrants | Serbia | 21.0 /100 | #197 | Fair 36.0% |
| Immigrants | Northern Africa | 19.9 /100 | #198 | Poor 35.9% |
| Immigrants | Norway | 19.8 /100 | #199 | Poor 35.9% |
| Immigrants | Sweden | 18.8 /100 | #200 | Poor 35.9% |
| Alsatians | 17.5 /100 | #201 | Poor 35.9% |
| Senegalese | 17.4 /100 | #202 | Poor 35.9% |
| Immigrants | Nigeria | 16.8 /100 | #203 | Poor 35.8% |
| Immigrants | Albania | 15.0 /100 | #204 | Poor 35.8% |
| South American Indians | 14.6 /100 | #205 | Poor 35.8% |
| Chileans | 14.6 /100 | #206 | Poor 35.8% |
| Immigrants | Eastern Europe | 14.5 /100 | #207 | Poor 35.8% |
| Koreans | 13.3 /100 | #208 | Poor 35.7% |
| Moroccans | 12.7 /100 | #209 | Poor 35.7% |