Indonesian vs South American In Labor Force | Age 16-19
COMPARE
Indonesian
South American
In Labor Force | Age 16-19
In Labor Force | Age 16-19 Comparison
Indonesians
South Americans
40.7%
IN LABOR FORCE | AGE 16-19
100.0/ 100
METRIC RATING
50th/ 347
METRIC RANK
33.6%
IN LABOR FORCE | AGE 16-19
0.2/ 100
METRIC RATING
286th/ 347
METRIC RANK
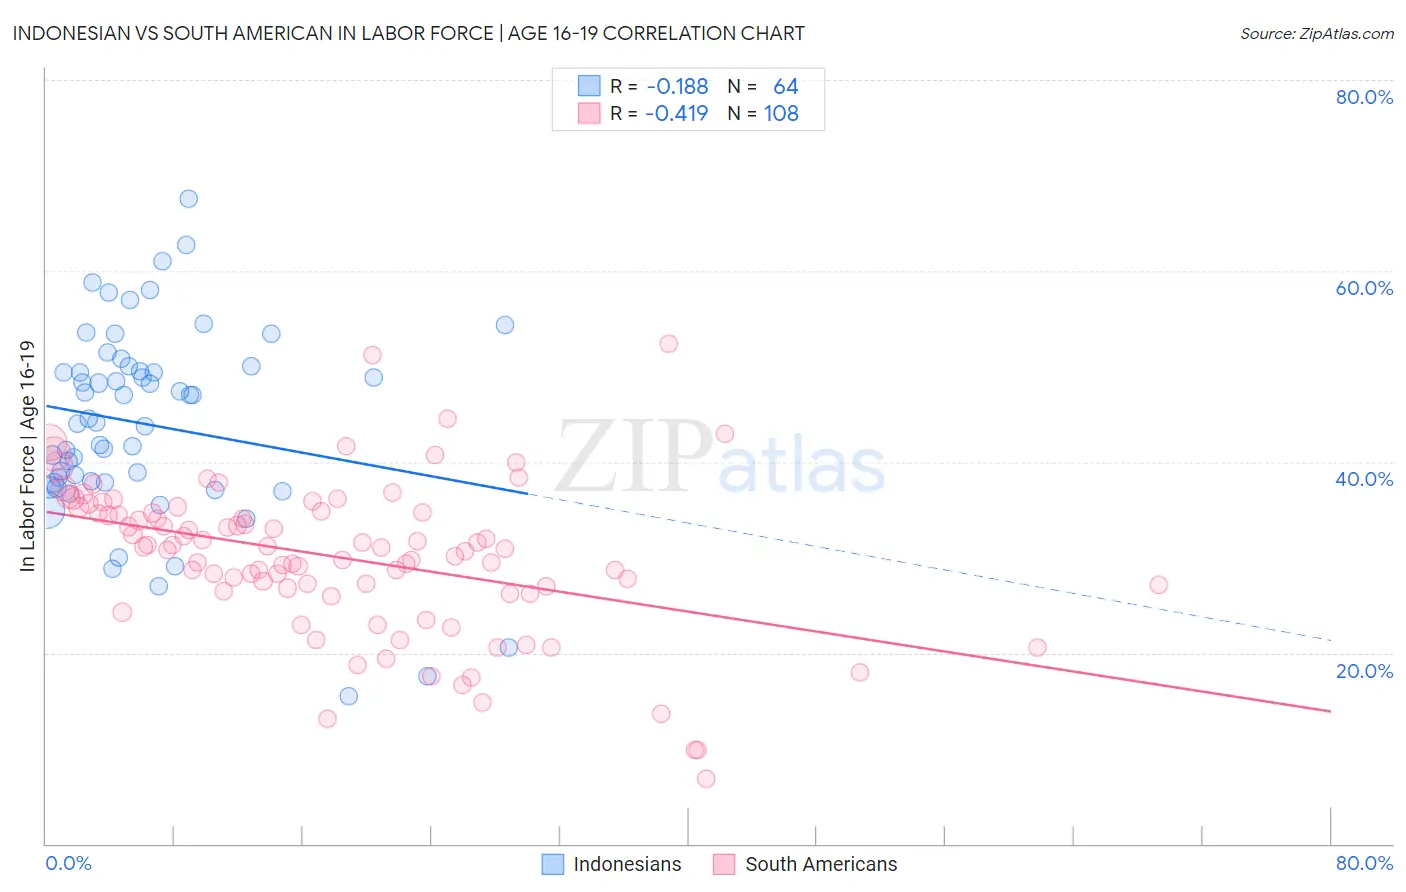
Indonesian vs South American In Labor Force | Age 16-19 Correlation Chart
The statistical analysis conducted on geographies consisting of 162,704,149 people shows a poor negative correlation between the proportion of Indonesians and labor force participation rate among population between the ages 16 and 19 in the United States with a correlation coefficient (R) of -0.188 and weighted average of 40.7%. Similarly, the statistical analysis conducted on geographies consisting of 492,865,168 people shows a moderate negative correlation between the proportion of South Americans and labor force participation rate among population between the ages 16 and 19 in the United States with a correlation coefficient (R) of -0.419 and weighted average of 33.6%, a difference of 21.2%.
In Labor Force | Age 16-19 Correlation Summary
| Measurement | Indonesian | South American |
| Minimum | 15.4% | 6.8% |
| Maximum | 67.6% | 52.4% |
| Range | 52.2% | 45.6% |
| Mean | 43.9% | 30.0% |
| Median | 44.3% | 31.0% |
| Interquartile 25% (IQ1) | 37.8% | 26.6% |
| Interquartile 75% (IQ3) | 49.8% | 34.8% |
| Interquartile Range (IQR) | 11.9% | 8.2% |
| Standard Deviation (Sample) | 10.3% | 8.0% |
| Standard Deviation (Population) | 10.2% | 8.0% |
Similar Demographics by In Labor Force | Age 16-19
Demographics Similar to Indonesians by In Labor Force | Age 16-19
In terms of in labor force | age 16-19, the demographic groups most similar to Indonesians are Immigrants from Zaire (40.7%, a difference of 0.10%), Cree (40.8%, a difference of 0.16%), Icelander (40.8%, a difference of 0.18%), Immigrants from Laos (40.6%, a difference of 0.19%), and Carpatho Rusyn (40.8%, a difference of 0.23%).
| Demographics | Rating | Rank | In Labor Force | Age 16-19 |
| Tongans | 100.0 /100 | #43 | Exceptional 41.2% |
| Europeans | 100.0 /100 | #44 | Exceptional 41.1% |
| Croatians | 100.0 /100 | #45 | Exceptional 41.1% |
| Immigrants | Sudan | 100.0 /100 | #46 | Exceptional 41.0% |
| Carpatho Rusyns | 100.0 /100 | #47 | Exceptional 40.8% |
| Icelanders | 100.0 /100 | #48 | Exceptional 40.8% |
| Cree | 100.0 /100 | #49 | Exceptional 40.8% |
| Indonesians | 100.0 /100 | #50 | Exceptional 40.7% |
| Immigrants | Zaire | 100.0 /100 | #51 | Exceptional 40.7% |
| Immigrants | Laos | 100.0 /100 | #52 | Exceptional 40.6% |
| Immigrants | Kenya | 100.0 /100 | #53 | Exceptional 40.5% |
| Tlingit-Haida | 100.0 /100 | #54 | Exceptional 40.5% |
| British | 100.0 /100 | #55 | Exceptional 40.5% |
| Fijians | 100.0 /100 | #56 | Exceptional 40.4% |
| Lithuanians | 100.0 /100 | #57 | Exceptional 40.4% |
Demographics Similar to South Americans by In Labor Force | Age 16-19
In terms of in labor force | age 16-19, the demographic groups most similar to South Americans are U.S. Virgin Islander (33.6%, a difference of 0.080%), Nepalese (33.5%, a difference of 0.23%), Immigrants from Spain (33.7%, a difference of 0.27%), Immigrants from Indonesia (33.5%, a difference of 0.27%), and Immigrants from Singapore (33.5%, a difference of 0.27%).
| Demographics | Rating | Rank | In Labor Force | Age 16-19 |
| Paraguayans | 0.3 /100 | #279 | Tragic 33.8% |
| Taiwanese | 0.3 /100 | #280 | Tragic 33.8% |
| Cypriots | 0.3 /100 | #281 | Tragic 33.8% |
| Immigrants | Korea | 0.3 /100 | #282 | Tragic 33.8% |
| Immigrants | Venezuela | 0.2 /100 | #283 | Tragic 33.7% |
| Immigrants | Spain | 0.2 /100 | #284 | Tragic 33.7% |
| U.S. Virgin Islanders | 0.2 /100 | #285 | Tragic 33.6% |
| South Americans | 0.2 /100 | #286 | Tragic 33.6% |
| Nepalese | 0.1 /100 | #287 | Tragic 33.5% |
| Immigrants | Indonesia | 0.1 /100 | #288 | Tragic 33.5% |
| Immigrants | Singapore | 0.1 /100 | #289 | Tragic 33.5% |
| Immigrants | Colombia | 0.1 /100 | #290 | Tragic 33.5% |
| Immigrants | Belarus | 0.1 /100 | #291 | Tragic 33.4% |
| Haitians | 0.1 /100 | #292 | Tragic 33.4% |
| Immigrants | South America | 0.1 /100 | #293 | Tragic 33.3% |