Indonesian vs Immigrants from Canada In Labor Force | Age 25-29
COMPARE
Indonesian
Immigrants from Canada
In Labor Force | Age 25-29
In Labor Force | Age 25-29 Comparison
Indonesians
Immigrants from Canada
84.7%
IN LABOR FORCE | AGE 25-29
56.5/ 100
METRIC RATING
167th/ 347
METRIC RANK
84.8%
IN LABOR FORCE | AGE 25-29
73.5/ 100
METRIC RATING
137th/ 347
METRIC RANK
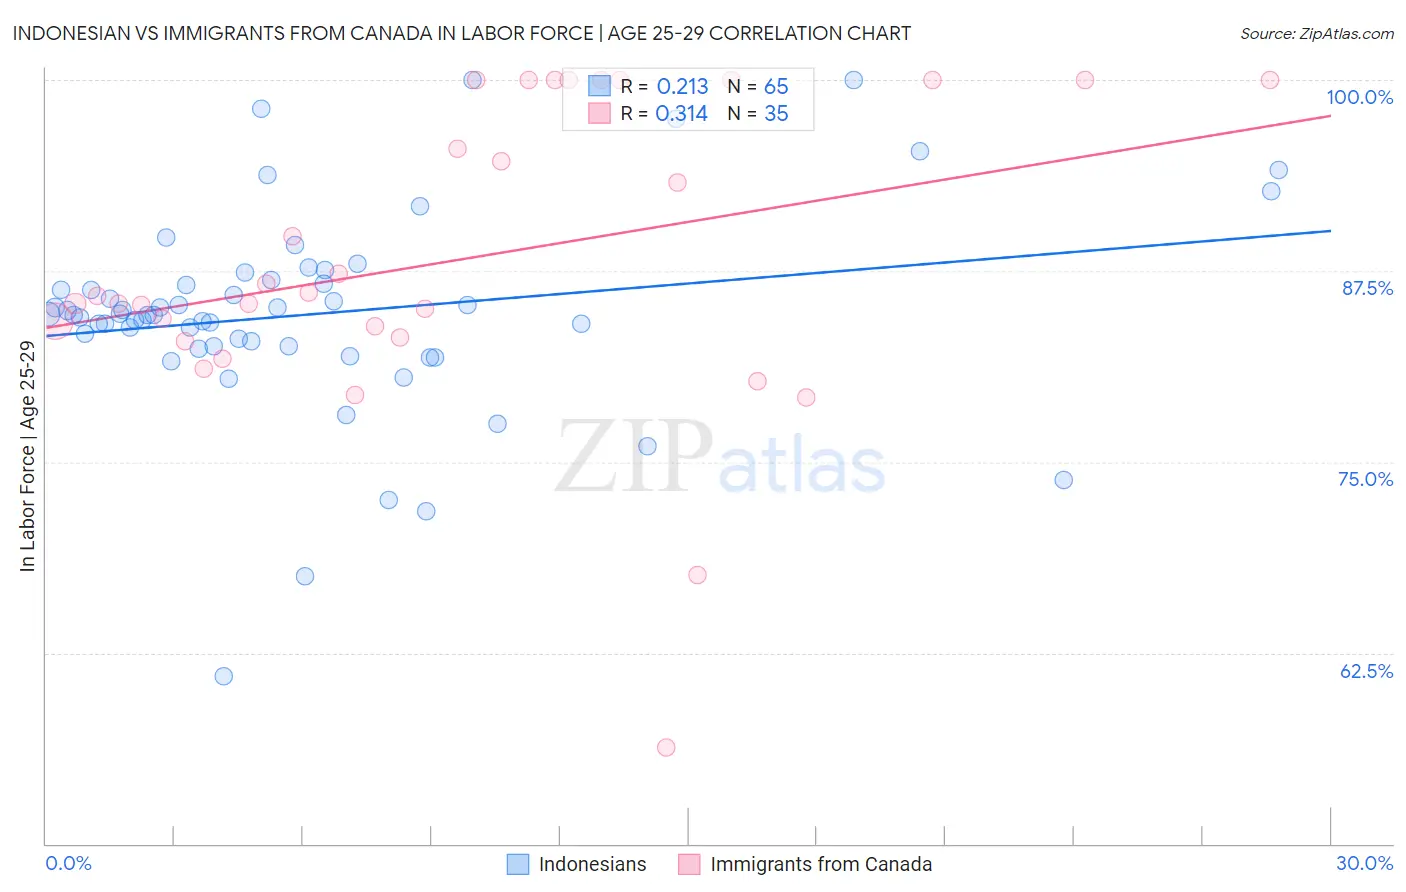
Indonesian vs Immigrants from Canada In Labor Force | Age 25-29 Correlation Chart
The statistical analysis conducted on geographies consisting of 162,720,182 people shows a weak positive correlation between the proportion of Indonesians and labor force participation rate among population between the ages 25 and 29 in the United States with a correlation coefficient (R) of 0.213 and weighted average of 84.7%. Similarly, the statistical analysis conducted on geographies consisting of 459,055,587 people shows a mild positive correlation between the proportion of Immigrants from Canada and labor force participation rate among population between the ages 25 and 29 in the United States with a correlation coefficient (R) of 0.314 and weighted average of 84.8%, a difference of 0.14%.
In Labor Force | Age 25-29 Correlation Summary
| Measurement | Indonesian | Immigrants from Canada |
| Minimum | 61.0% | 56.3% |
| Maximum | 100.0% | 100.0% |
| Range | 39.0% | 43.7% |
| Mean | 84.7% | 88.3% |
| Median | 84.6% | 85.9% |
| Interquartile 25% (IQ1) | 82.6% | 83.2% |
| Interquartile 75% (IQ3) | 86.8% | 100.0% |
| Interquartile Range (IQR) | 4.2% | 16.8% |
| Standard Deviation (Sample) | 6.7% | 10.0% |
| Standard Deviation (Population) | 6.6% | 9.9% |
Similar Demographics by In Labor Force | Age 25-29
Demographics Similar to Indonesians by In Labor Force | Age 25-29
In terms of in labor force | age 25-29, the demographic groups most similar to Indonesians are Immigrants from Spain (84.7%, a difference of 0.0%), Immigrants from Colombia (84.7%, a difference of 0.010%), Argentinean (84.7%, a difference of 0.010%), Ghanaian (84.7%, a difference of 0.010%), and Immigrants from Burma/Myanmar (84.7%, a difference of 0.010%).
| Demographics | Rating | Rank | In Labor Force | Age 25-29 |
| Immigrants | Peru | 58.6 /100 | #160 | Average 84.7% |
| Canadians | 58.5 /100 | #161 | Average 84.7% |
| Immigrants | Colombia | 58.3 /100 | #162 | Average 84.7% |
| Argentineans | 57.9 /100 | #163 | Average 84.7% |
| Ghanaians | 57.6 /100 | #164 | Average 84.7% |
| Immigrants | Burma/Myanmar | 57.4 /100 | #165 | Average 84.7% |
| Immigrants | Spain | 56.9 /100 | #166 | Average 84.7% |
| Indonesians | 56.5 /100 | #167 | Average 84.7% |
| South Americans | 54.9 /100 | #168 | Average 84.7% |
| Celtics | 52.5 /100 | #169 | Average 84.7% |
| Tongans | 52.4 /100 | #170 | Average 84.7% |
| Immigrants | Vietnam | 50.5 /100 | #171 | Average 84.7% |
| Immigrants | Western Europe | 50.4 /100 | #172 | Average 84.7% |
| Assyrians/Chaldeans/Syriacs | 50.2 /100 | #173 | Average 84.7% |
| Palestinians | 50.0 /100 | #174 | Average 84.7% |
Demographics Similar to Immigrants from Canada by In Labor Force | Age 25-29
In terms of in labor force | age 25-29, the demographic groups most similar to Immigrants from Canada are Armenian (84.8%, a difference of 0.010%), Immigrants from Eastern Asia (84.8%, a difference of 0.010%), Immigrants from North America (84.8%, a difference of 0.010%), Bhutanese (84.8%, a difference of 0.020%), and Danish (84.8%, a difference of 0.020%).
| Demographics | Rating | Rank | In Labor Force | Age 25-29 |
| Northern Europeans | 81.3 /100 | #130 | Excellent 84.9% |
| Iranians | 78.1 /100 | #131 | Good 84.8% |
| Romanians | 77.7 /100 | #132 | Good 84.8% |
| Asians | 77.7 /100 | #133 | Good 84.8% |
| Syrians | 76.5 /100 | #134 | Good 84.8% |
| Immigrants | Hungary | 76.4 /100 | #135 | Good 84.8% |
| Bhutanese | 76.0 /100 | #136 | Good 84.8% |
| Immigrants | Canada | 73.5 /100 | #137 | Good 84.8% |
| Armenians | 72.7 /100 | #138 | Good 84.8% |
| Immigrants | Eastern Asia | 72.6 /100 | #139 | Good 84.8% |
| Immigrants | North America | 72.1 /100 | #140 | Good 84.8% |
| Danes | 71.9 /100 | #141 | Good 84.8% |
| Pakistanis | 70.0 /100 | #142 | Good 84.8% |
| Sri Lankans | 69.2 /100 | #143 | Good 84.8% |
| Immigrants | Laos | 69.0 /100 | #144 | Good 84.8% |