Indonesian vs Guamanian/Chamorro In Labor Force | Age 25-29
COMPARE
Indonesian
Guamanian/Chamorro
In Labor Force | Age 25-29
In Labor Force | Age 25-29 Comparison
Indonesians
Guamanians/Chamorros
84.7%
IN LABOR FORCE | AGE 25-29
56.5/ 100
METRIC RATING
167th/ 347
METRIC RANK
83.9%
IN LABOR FORCE | AGE 25-29
0.9/ 100
METRIC RATING
236th/ 347
METRIC RANK
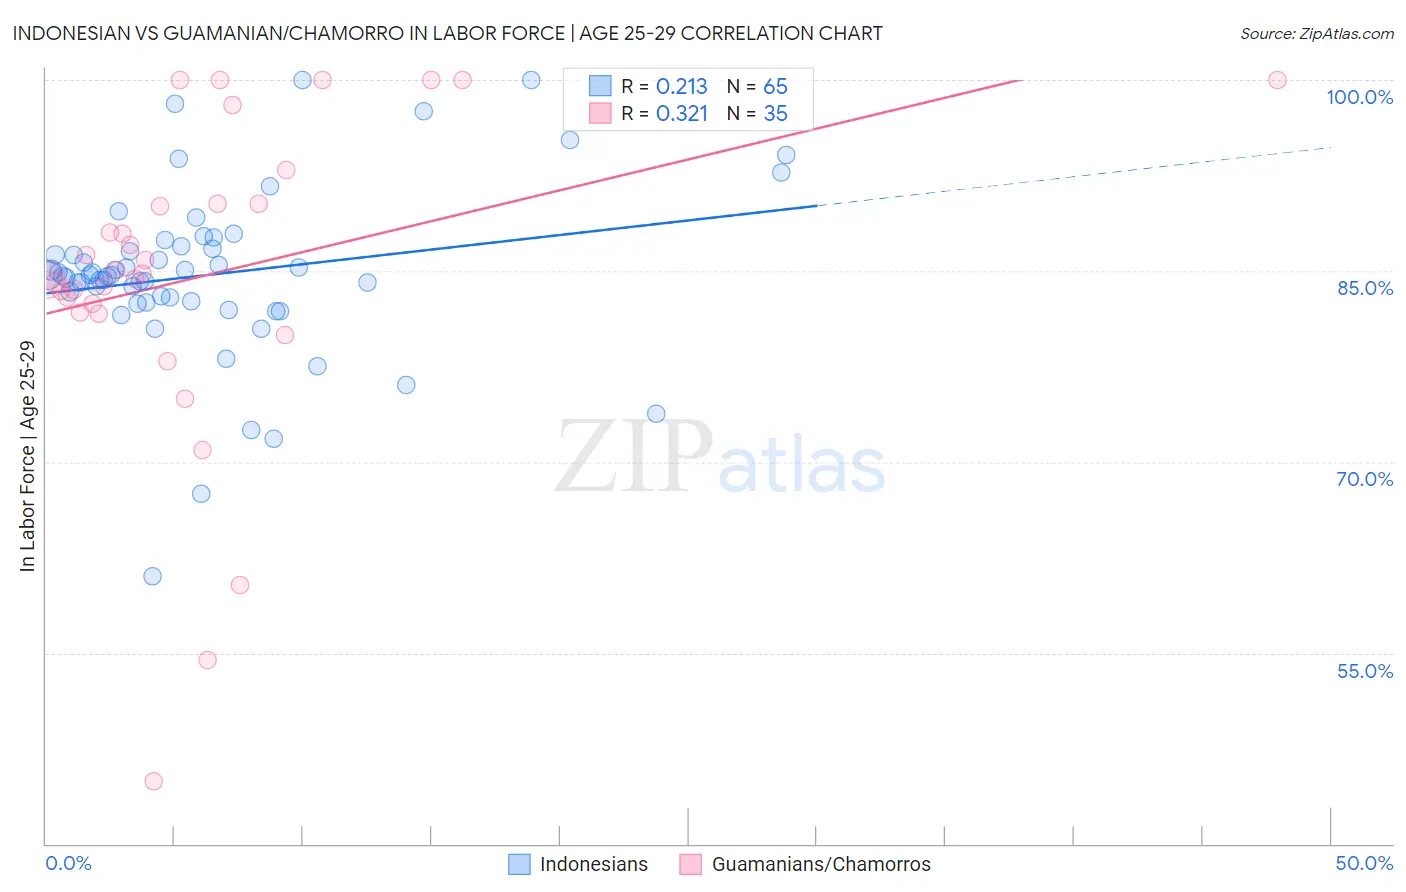
Indonesian vs Guamanian/Chamorro In Labor Force | Age 25-29 Correlation Chart
The statistical analysis conducted on geographies consisting of 162,720,182 people shows a weak positive correlation between the proportion of Indonesians and labor force participation rate among population between the ages 25 and 29 in the United States with a correlation coefficient (R) of 0.213 and weighted average of 84.7%. Similarly, the statistical analysis conducted on geographies consisting of 221,933,719 people shows a mild positive correlation between the proportion of Guamanians/Chamorros and labor force participation rate among population between the ages 25 and 29 in the United States with a correlation coefficient (R) of 0.321 and weighted average of 83.9%, a difference of 0.92%.
In Labor Force | Age 25-29 Correlation Summary
| Measurement | Indonesian | Guamanian/Chamorro |
| Minimum | 61.0% | 44.9% |
| Maximum | 100.0% | 100.0% |
| Range | 39.0% | 55.1% |
| Mean | 84.7% | 84.6% |
| Median | 84.6% | 84.8% |
| Interquartile 25% (IQ1) | 82.6% | 81.8% |
| Interquartile 75% (IQ3) | 86.8% | 90.3% |
| Interquartile Range (IQR) | 4.2% | 8.6% |
| Standard Deviation (Sample) | 6.7% | 12.4% |
| Standard Deviation (Population) | 6.6% | 12.3% |
Similar Demographics by In Labor Force | Age 25-29
Demographics Similar to Indonesians by In Labor Force | Age 25-29
In terms of in labor force | age 25-29, the demographic groups most similar to Indonesians are Immigrants from Spain (84.7%, a difference of 0.0%), Immigrants from Colombia (84.7%, a difference of 0.010%), Argentinean (84.7%, a difference of 0.010%), Ghanaian (84.7%, a difference of 0.010%), and Immigrants from Burma/Myanmar (84.7%, a difference of 0.010%).
| Demographics | Rating | Rank | In Labor Force | Age 25-29 |
| Immigrants | Peru | 58.6 /100 | #160 | Average 84.7% |
| Canadians | 58.5 /100 | #161 | Average 84.7% |
| Immigrants | Colombia | 58.3 /100 | #162 | Average 84.7% |
| Argentineans | 57.9 /100 | #163 | Average 84.7% |
| Ghanaians | 57.6 /100 | #164 | Average 84.7% |
| Immigrants | Burma/Myanmar | 57.4 /100 | #165 | Average 84.7% |
| Immigrants | Spain | 56.9 /100 | #166 | Average 84.7% |
| Indonesians | 56.5 /100 | #167 | Average 84.7% |
| South Americans | 54.9 /100 | #168 | Average 84.7% |
| Celtics | 52.5 /100 | #169 | Average 84.7% |
| Tongans | 52.4 /100 | #170 | Average 84.7% |
| Immigrants | Vietnam | 50.5 /100 | #171 | Average 84.7% |
| Immigrants | Western Europe | 50.4 /100 | #172 | Average 84.7% |
| Assyrians/Chaldeans/Syriacs | 50.2 /100 | #173 | Average 84.7% |
| Palestinians | 50.0 /100 | #174 | Average 84.7% |
Demographics Similar to Guamanians/Chamorros by In Labor Force | Age 25-29
In terms of in labor force | age 25-29, the demographic groups most similar to Guamanians/Chamorros are Iraqi (83.9%, a difference of 0.0%), Immigrants (83.9%, a difference of 0.0%), Barbadian (83.9%, a difference of 0.020%), Immigrants from Uzbekistan (83.9%, a difference of 0.030%), and Jamaican (83.9%, a difference of 0.040%).
| Demographics | Rating | Rank | In Labor Force | Age 25-29 |
| Immigrants | Oceania | 5.0 /100 | #229 | Tragic 84.2% |
| Whites/Caucasians | 4.8 /100 | #230 | Tragic 84.2% |
| Immigrants | Philippines | 4.7 /100 | #231 | Tragic 84.2% |
| Panamanians | 4.5 /100 | #232 | Tragic 84.2% |
| Immigrants | Western Asia | 2.7 /100 | #233 | Tragic 84.1% |
| Barbadians | 1.0 /100 | #234 | Tragic 83.9% |
| Iraqis | 0.9 /100 | #235 | Tragic 83.9% |
| Guamanians/Chamorros | 0.9 /100 | #236 | Tragic 83.9% |
| Immigrants | Immigrants | 0.9 /100 | #237 | Tragic 83.9% |
| Immigrants | Uzbekistan | 0.8 /100 | #238 | Tragic 83.9% |
| Jamaicans | 0.8 /100 | #239 | Tragic 83.9% |
| Trinidadians and Tobagonians | 0.7 /100 | #240 | Tragic 83.9% |
| Alsatians | 0.7 /100 | #241 | Tragic 83.9% |
| U.S. Virgin Islanders | 0.6 /100 | #242 | Tragic 83.8% |
| Salvadorans | 0.5 /100 | #243 | Tragic 83.8% |