Panamanian vs Cypriot In Labor Force | Age 16-19
COMPARE
Panamanian
Cypriot
In Labor Force | Age 16-19
In Labor Force | Age 16-19 Comparison
Panamanians
Cypriots
36.1%
IN LABOR FORCE | AGE 16-19
28.6/ 100
METRIC RATING
190th/ 347
METRIC RANK
33.8%
IN LABOR FORCE | AGE 16-19
0.3/ 100
METRIC RATING
281st/ 347
METRIC RANK
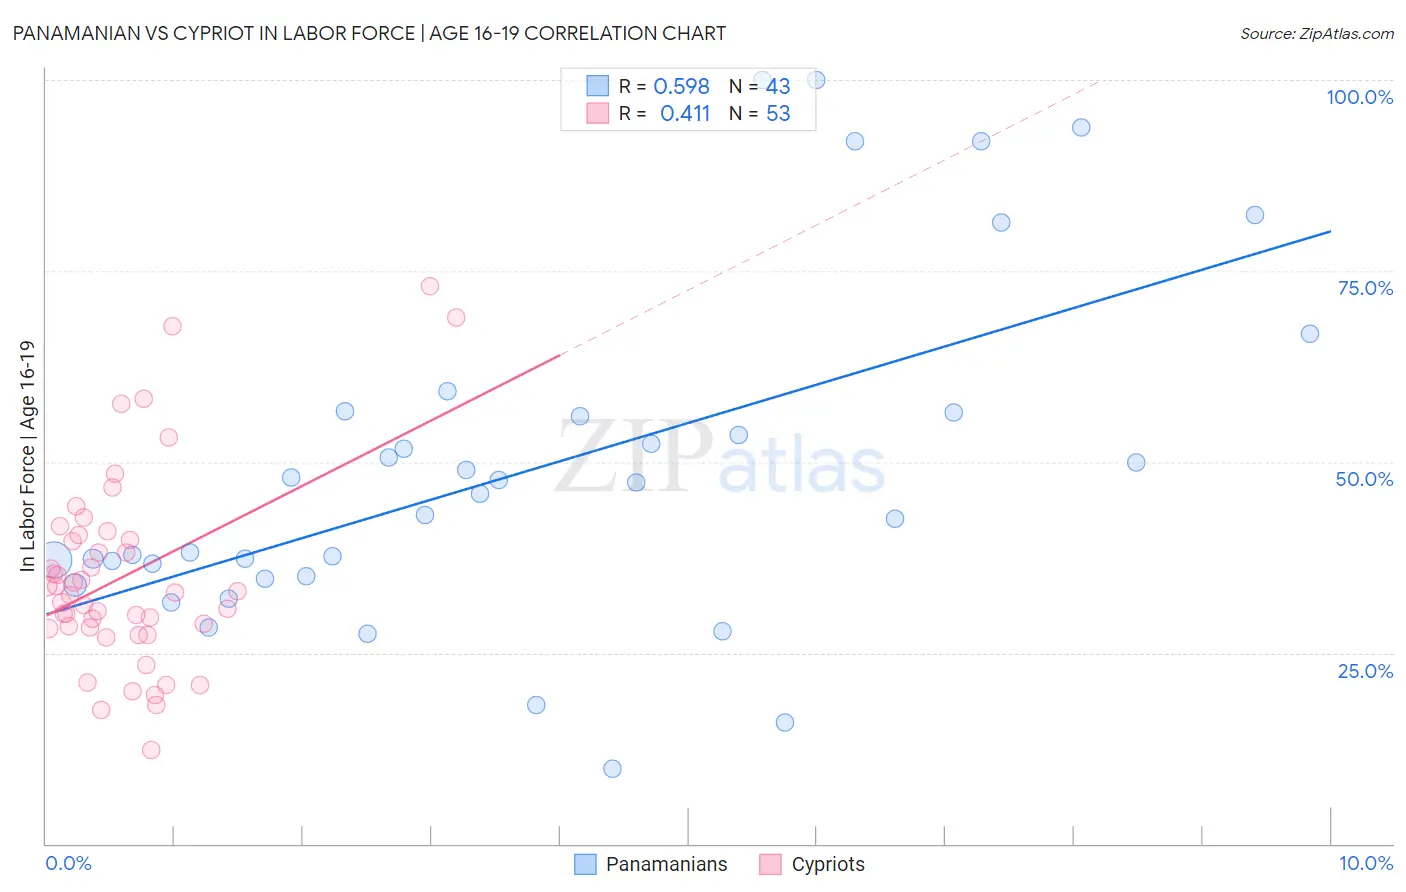
Panamanian vs Cypriot In Labor Force | Age 16-19 Correlation Chart
The statistical analysis conducted on geographies consisting of 281,056,655 people shows a substantial positive correlation between the proportion of Panamanians and labor force participation rate among population between the ages 16 and 19 in the United States with a correlation coefficient (R) of 0.598 and weighted average of 36.1%. Similarly, the statistical analysis conducted on geographies consisting of 61,837,622 people shows a moderate positive correlation between the proportion of Cypriots and labor force participation rate among population between the ages 16 and 19 in the United States with a correlation coefficient (R) of 0.411 and weighted average of 33.8%, a difference of 6.9%.
In Labor Force | Age 16-19 Correlation Summary
| Measurement | Panamanian | Cypriot |
| Minimum | 9.9% | 12.3% |
| Maximum | 100.0% | 73.0% |
| Range | 90.1% | 60.7% |
| Mean | 49.1% | 35.1% |
| Median | 45.8% | 32.9% |
| Interquartile 25% (IQ1) | 35.1% | 28.2% |
| Interquartile 75% (IQ3) | 56.4% | 40.1% |
| Interquartile Range (IQR) | 21.3% | 11.9% |
| Standard Deviation (Sample) | 22.4% | 12.8% |
| Standard Deviation (Population) | 22.1% | 12.7% |
Similar Demographics by In Labor Force | Age 16-19
Demographics Similar to Panamanians by In Labor Force | Age 16-19
In terms of in labor force | age 16-19, the demographic groups most similar to Panamanians are Immigrants from Hungary (36.2%, a difference of 0.010%), Immigrants from Croatia (36.1%, a difference of 0.070%), Immigrants from Europe (36.2%, a difference of 0.19%), Afghan (36.1%, a difference of 0.19%), and Immigrants from Denmark (36.1%, a difference of 0.23%).
| Demographics | Rating | Rank | In Labor Force | Age 16-19 |
| Eastern Europeans | 38.8 /100 | #183 | Fair 36.4% |
| Costa Ricans | 36.1 /100 | #184 | Fair 36.3% |
| Bhutanese | 35.3 /100 | #185 | Fair 36.3% |
| Immigrants | Romania | 34.0 /100 | #186 | Fair 36.3% |
| Immigrants | Afghanistan | 34.0 /100 | #187 | Fair 36.3% |
| Immigrants | Europe | 31.8 /100 | #188 | Fair 36.2% |
| Immigrants | Hungary | 28.8 /100 | #189 | Fair 36.2% |
| Panamanians | 28.6 /100 | #190 | Fair 36.1% |
| Immigrants | Croatia | 27.5 /100 | #191 | Fair 36.1% |
| Afghans | 25.7 /100 | #192 | Fair 36.1% |
| Immigrants | Denmark | 25.0 /100 | #193 | Fair 36.1% |
| Nigerians | 24.6 /100 | #194 | Fair 36.1% |
| Bolivians | 23.3 /100 | #195 | Fair 36.0% |
| Mexican American Indians | 21.1 /100 | #196 | Fair 36.0% |
| Immigrants | Serbia | 21.0 /100 | #197 | Fair 36.0% |
Demographics Similar to Cypriots by In Labor Force | Age 16-19
In terms of in labor force | age 16-19, the demographic groups most similar to Cypriots are Paraguayan (33.8%, a difference of 0.010%), Taiwanese (33.8%, a difference of 0.010%), Immigrants from Korea (33.8%, a difference of 0.010%), Colombian (33.8%, a difference of 0.020%), and Menominee (33.9%, a difference of 0.10%).
| Demographics | Rating | Rank | In Labor Force | Age 16-19 |
| Venezuelans | 0.3 /100 | #274 | Tragic 34.0% |
| Immigrants | Fiji | 0.3 /100 | #275 | Tragic 33.9% |
| Immigrants | Latin America | 0.3 /100 | #276 | Tragic 33.9% |
| Menominee | 0.3 /100 | #277 | Tragic 33.9% |
| Colombians | 0.3 /100 | #278 | Tragic 33.8% |
| Paraguayans | 0.3 /100 | #279 | Tragic 33.8% |
| Taiwanese | 0.3 /100 | #280 | Tragic 33.8% |
| Cypriots | 0.3 /100 | #281 | Tragic 33.8% |
| Immigrants | Korea | 0.3 /100 | #282 | Tragic 33.8% |
| Immigrants | Venezuela | 0.2 /100 | #283 | Tragic 33.7% |
| Immigrants | Spain | 0.2 /100 | #284 | Tragic 33.7% |
| U.S. Virgin Islanders | 0.2 /100 | #285 | Tragic 33.6% |
| South Americans | 0.2 /100 | #286 | Tragic 33.6% |
| Nepalese | 0.1 /100 | #287 | Tragic 33.5% |
| Immigrants | Indonesia | 0.1 /100 | #288 | Tragic 33.5% |