Indian (Asian) vs Cypriot Family Households with Children
COMPARE
Indian (Asian)
Cypriot
Family Households with Children
Family Households with Children Comparison
Indians (Asian)
Cypriots
27.6%
FAMILY HOUSEHOLDS WITH CHILDREN
71.6/ 100
METRIC RATING
157th/ 347
METRIC RANK
25.9%
FAMILY HOUSEHOLDS WITH CHILDREN
0.0/ 100
METRIC RATING
329th/ 347
METRIC RANK
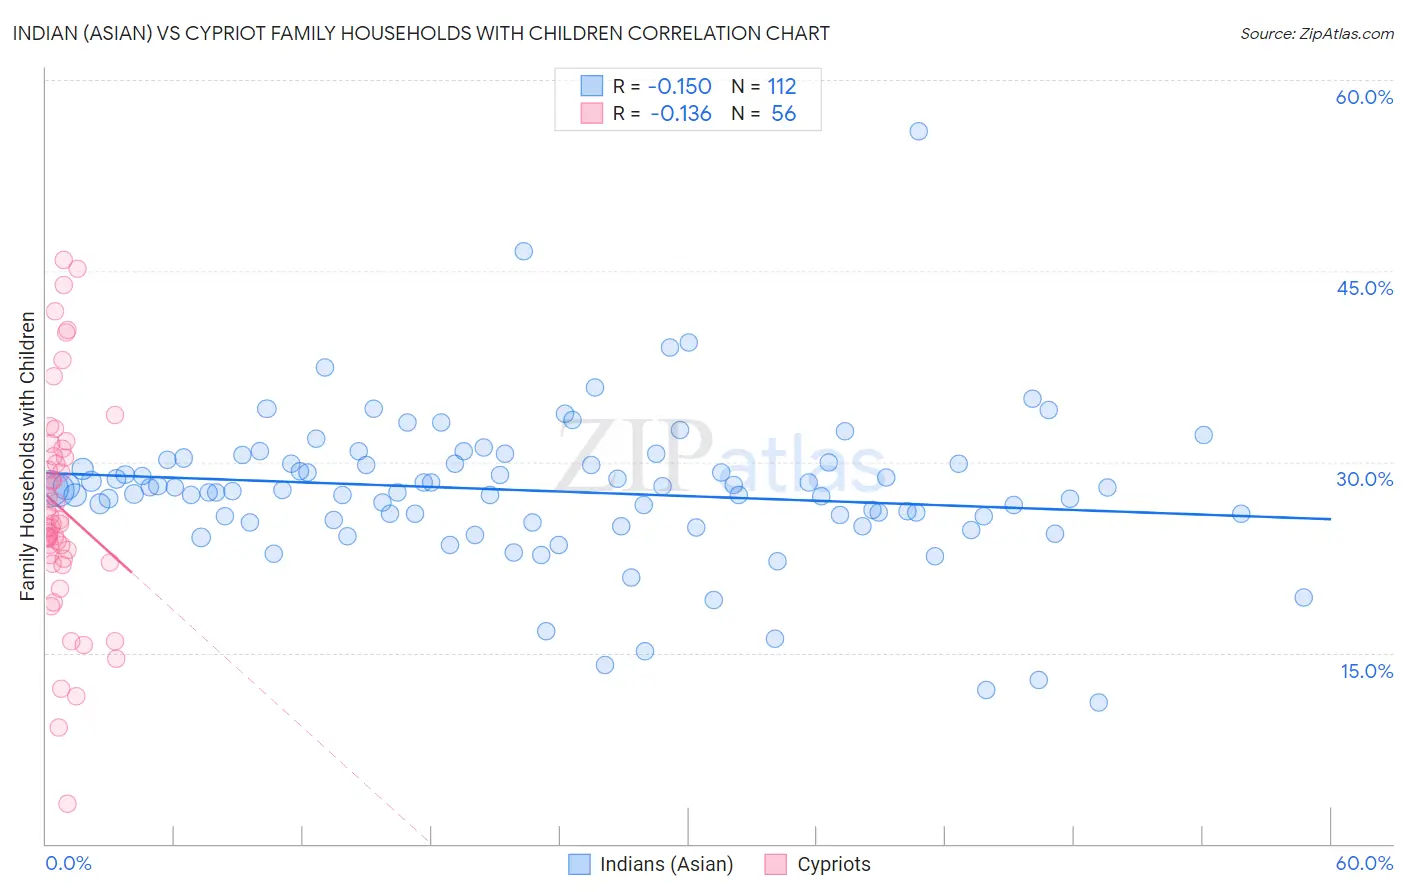
Indian (Asian) vs Cypriot Family Households with Children Correlation Chart
The statistical analysis conducted on geographies consisting of 494,524,246 people shows a poor negative correlation between the proportion of Indians (Asian) and percentage of family households with children in the United States with a correlation coefficient (R) of -0.150 and weighted average of 27.6%. Similarly, the statistical analysis conducted on geographies consisting of 61,838,668 people shows a poor negative correlation between the proportion of Cypriots and percentage of family households with children in the United States with a correlation coefficient (R) of -0.136 and weighted average of 25.9%, a difference of 6.5%.
Family Households with Children Correlation Summary
| Measurement | Indian (Asian) | Cypriot |
| Minimum | 11.1% | 3.1% |
| Maximum | 55.9% | 45.8% |
| Range | 44.9% | 42.7% |
| Mean | 27.7% | 26.3% |
| Median | 27.8% | 25.1% |
| Interquartile 25% (IQ1) | 25.6% | 22.3% |
| Interquartile 75% (IQ3) | 29.9% | 30.8% |
| Interquartile Range (IQR) | 4.3% | 8.5% |
| Standard Deviation (Sample) | 5.9% | 8.8% |
| Standard Deviation (Population) | 5.9% | 8.7% |
Similar Demographics by Family Households with Children
Demographics Similar to Indians (Asian) by Family Households with Children
In terms of family households with children, the demographic groups most similar to Indians (Asian) are Romanian (27.6%, a difference of 0.020%), Mongolian (27.6%, a difference of 0.020%), Hungarian (27.6%, a difference of 0.080%), Comanche (27.6%, a difference of 0.090%), and Icelander (27.6%, a difference of 0.10%).
| Demographics | Rating | Rank | Family Households with Children |
| Argentineans | 78.5 /100 | #150 | Good 27.6% |
| Portuguese | 77.8 /100 | #151 | Good 27.6% |
| Ethiopians | 77.0 /100 | #152 | Good 27.6% |
| Immigrants | Cabo Verde | 75.6 /100 | #153 | Good 27.6% |
| Icelanders | 75.3 /100 | #154 | Good 27.6% |
| Comanche | 74.8 /100 | #155 | Good 27.6% |
| Hungarians | 74.6 /100 | #156 | Good 27.6% |
| Indians (Asian) | 71.6 /100 | #157 | Good 27.6% |
| Romanians | 70.8 /100 | #158 | Good 27.6% |
| Mongolians | 70.7 /100 | #159 | Good 27.6% |
| Sub-Saharan Africans | 67.5 /100 | #160 | Good 27.6% |
| Alaskan Athabascans | 67.1 /100 | #161 | Good 27.6% |
| Immigrants | Bangladesh | 67.0 /100 | #162 | Good 27.6% |
| Czechs | 65.3 /100 | #163 | Good 27.5% |
| Immigrants | Hong Kong | 64.9 /100 | #164 | Good 27.5% |
Demographics Similar to Cypriots by Family Households with Children
In terms of family households with children, the demographic groups most similar to Cypriots are Immigrants from Albania (25.9%, a difference of 0.13%), Immigrants from Latvia (25.9%, a difference of 0.18%), Immigrants from Barbados (26.0%, a difference of 0.23%), Slovene (25.8%, a difference of 0.31%), and Immigrants from Ireland (26.0%, a difference of 0.33%).
| Demographics | Rating | Rank | Family Households with Children |
| Immigrants | Greece | 0.0 /100 | #322 | Tragic 26.0% |
| Immigrants | Australia | 0.0 /100 | #323 | Tragic 26.0% |
| Chinese | 0.0 /100 | #324 | Tragic 26.0% |
| Barbadians | 0.0 /100 | #325 | Tragic 26.0% |
| Immigrants | Ireland | 0.0 /100 | #326 | Tragic 26.0% |
| Immigrants | Barbados | 0.0 /100 | #327 | Tragic 26.0% |
| Immigrants | Albania | 0.0 /100 | #328 | Tragic 25.9% |
| Cypriots | 0.0 /100 | #329 | Tragic 25.9% |
| Immigrants | Latvia | 0.0 /100 | #330 | Tragic 25.9% |
| Slovenes | 0.0 /100 | #331 | Tragic 25.8% |
| Immigrants | Austria | 0.0 /100 | #332 | Tragic 25.8% |
| Immigrants | Switzerland | 0.0 /100 | #333 | Tragic 25.7% |
| Slovaks | 0.0 /100 | #334 | Tragic 25.7% |
| Immigrants | Croatia | 0.0 /100 | #335 | Tragic 25.7% |
| Immigrants | West Indies | 0.0 /100 | #336 | Tragic 25.7% |