Immigrants from Morocco vs Cypriot In Labor Force | Age 16-19
COMPARE
Immigrants from Morocco
Cypriot
In Labor Force | Age 16-19
In Labor Force | Age 16-19 Comparison
Immigrants from Morocco
Cypriots
36.4%
IN LABOR FORCE | AGE 16-19
41.1/ 100
METRIC RATING
180th/ 347
METRIC RANK
33.8%
IN LABOR FORCE | AGE 16-19
0.3/ 100
METRIC RATING
281st/ 347
METRIC RANK
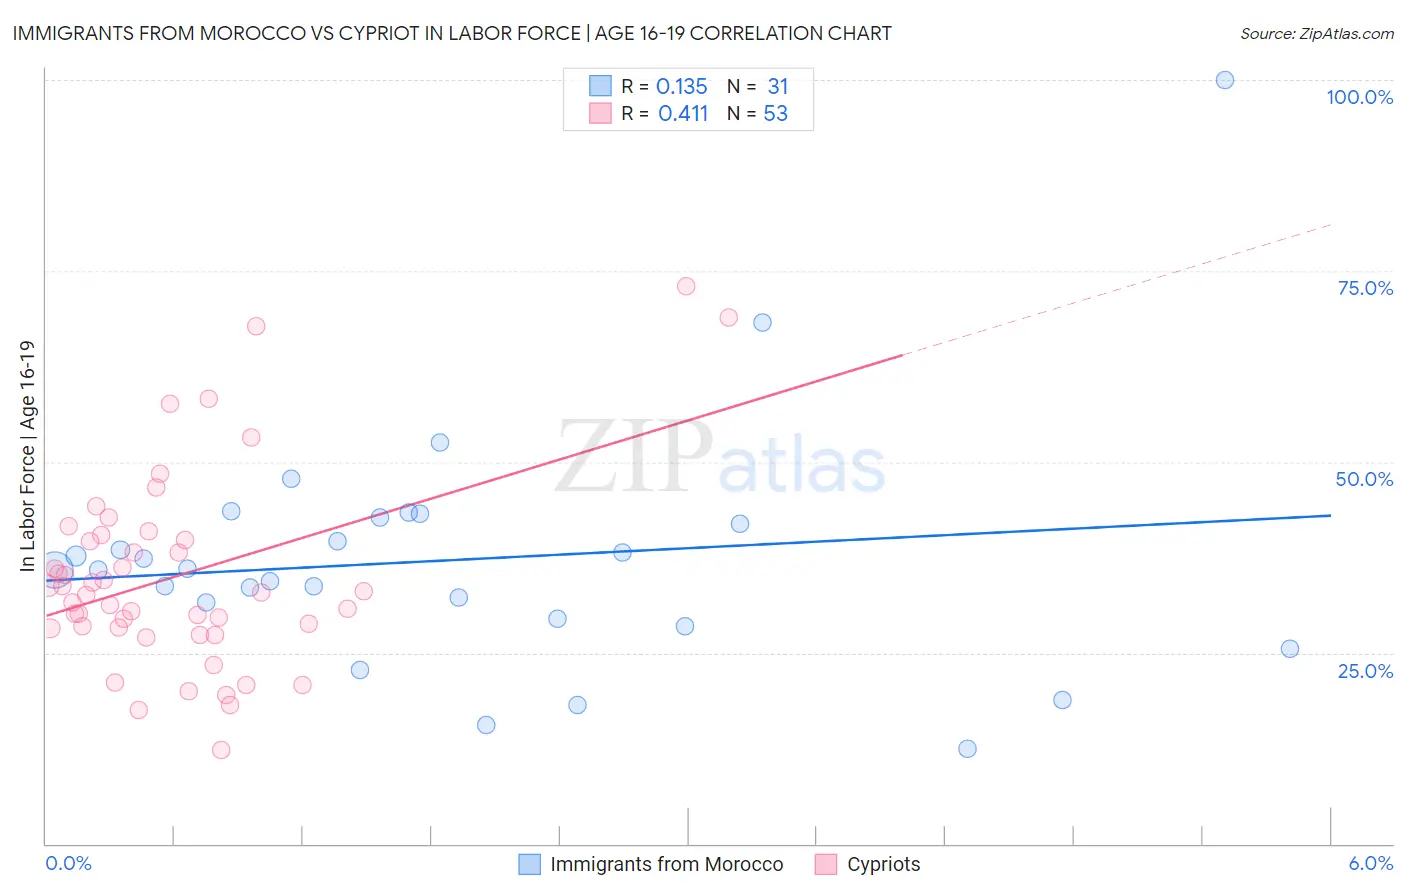
Immigrants from Morocco vs Cypriot In Labor Force | Age 16-19 Correlation Chart
The statistical analysis conducted on geographies consisting of 178,800,996 people shows a poor positive correlation between the proportion of Immigrants from Morocco and labor force participation rate among population between the ages 16 and 19 in the United States with a correlation coefficient (R) of 0.135 and weighted average of 36.4%. Similarly, the statistical analysis conducted on geographies consisting of 61,837,622 people shows a moderate positive correlation between the proportion of Cypriots and labor force participation rate among population between the ages 16 and 19 in the United States with a correlation coefficient (R) of 0.411 and weighted average of 33.8%, a difference of 7.6%.
In Labor Force | Age 16-19 Correlation Summary
| Measurement | Immigrants from Morocco | Cypriot |
| Minimum | 12.5% | 12.3% |
| Maximum | 100.0% | 73.0% |
| Range | 87.5% | 60.7% |
| Mean | 37.2% | 35.1% |
| Median | 35.9% | 32.9% |
| Interquartile 25% (IQ1) | 29.4% | 28.2% |
| Interquartile 75% (IQ3) | 42.6% | 40.1% |
| Interquartile Range (IQR) | 13.2% | 11.9% |
| Standard Deviation (Sample) | 16.1% | 12.8% |
| Standard Deviation (Population) | 15.9% | 12.7% |
Similar Demographics by In Labor Force | Age 16-19
Demographics Similar to Immigrants from Morocco by In Labor Force | Age 16-19
In terms of in labor force | age 16-19, the demographic groups most similar to Immigrants from Morocco are Jordanian (36.4%, a difference of 0.080%), Immigrants from Italy (36.4%, a difference of 0.10%), Immigrants from Southern Europe (36.4%, a difference of 0.12%), Eastern European (36.4%, a difference of 0.12%), and Black/African American (36.5%, a difference of 0.21%).
| Demographics | Rating | Rank | In Labor Force | Age 16-19 |
| Russians | 57.5 /100 | #173 | Average 36.7% |
| Immigrants | Czechoslovakia | 50.0 /100 | #174 | Average 36.6% |
| Natives/Alaskans | 49.0 /100 | #175 | Average 36.6% |
| Albanians | 48.8 /100 | #176 | Average 36.5% |
| Immigrants | Northern Europe | 46.6 /100 | #177 | Average 36.5% |
| Blacks/African Americans | 45.1 /100 | #178 | Average 36.5% |
| Immigrants | Southern Europe | 43.3 /100 | #179 | Average 36.4% |
| Immigrants | Morocco | 41.1 /100 | #180 | Average 36.4% |
| Jordanians | 39.6 /100 | #181 | Fair 36.4% |
| Immigrants | Italy | 39.1 /100 | #182 | Fair 36.4% |
| Eastern Europeans | 38.8 /100 | #183 | Fair 36.4% |
| Costa Ricans | 36.1 /100 | #184 | Fair 36.3% |
| Bhutanese | 35.3 /100 | #185 | Fair 36.3% |
| Immigrants | Romania | 34.0 /100 | #186 | Fair 36.3% |
| Immigrants | Afghanistan | 34.0 /100 | #187 | Fair 36.3% |
Demographics Similar to Cypriots by In Labor Force | Age 16-19
In terms of in labor force | age 16-19, the demographic groups most similar to Cypriots are Paraguayan (33.8%, a difference of 0.010%), Taiwanese (33.8%, a difference of 0.010%), Immigrants from Korea (33.8%, a difference of 0.010%), Colombian (33.8%, a difference of 0.020%), and Menominee (33.9%, a difference of 0.10%).
| Demographics | Rating | Rank | In Labor Force | Age 16-19 |
| Venezuelans | 0.3 /100 | #274 | Tragic 34.0% |
| Immigrants | Fiji | 0.3 /100 | #275 | Tragic 33.9% |
| Immigrants | Latin America | 0.3 /100 | #276 | Tragic 33.9% |
| Menominee | 0.3 /100 | #277 | Tragic 33.9% |
| Colombians | 0.3 /100 | #278 | Tragic 33.8% |
| Paraguayans | 0.3 /100 | #279 | Tragic 33.8% |
| Taiwanese | 0.3 /100 | #280 | Tragic 33.8% |
| Cypriots | 0.3 /100 | #281 | Tragic 33.8% |
| Immigrants | Korea | 0.3 /100 | #282 | Tragic 33.8% |
| Immigrants | Venezuela | 0.2 /100 | #283 | Tragic 33.7% |
| Immigrants | Spain | 0.2 /100 | #284 | Tragic 33.7% |
| U.S. Virgin Islanders | 0.2 /100 | #285 | Tragic 33.6% |
| South Americans | 0.2 /100 | #286 | Tragic 33.6% |
| Nepalese | 0.1 /100 | #287 | Tragic 33.5% |
| Immigrants | Indonesia | 0.1 /100 | #288 | Tragic 33.5% |