Immigrants from Zaire vs Ghanaian In Labor Force | Age 20-64
COMPARE
Immigrants from Zaire
Ghanaian
In Labor Force | Age 20-64
In Labor Force | Age 20-64 Comparison
Immigrants from Zaire
Ghanaians
79.9%
IN LABOR FORCE | AGE 20-64
88.6/ 100
METRIC RATING
130th/ 347
METRIC RANK
80.1%
IN LABOR FORCE | AGE 20-64
96.7/ 100
METRIC RATING
92nd/ 347
METRIC RANK
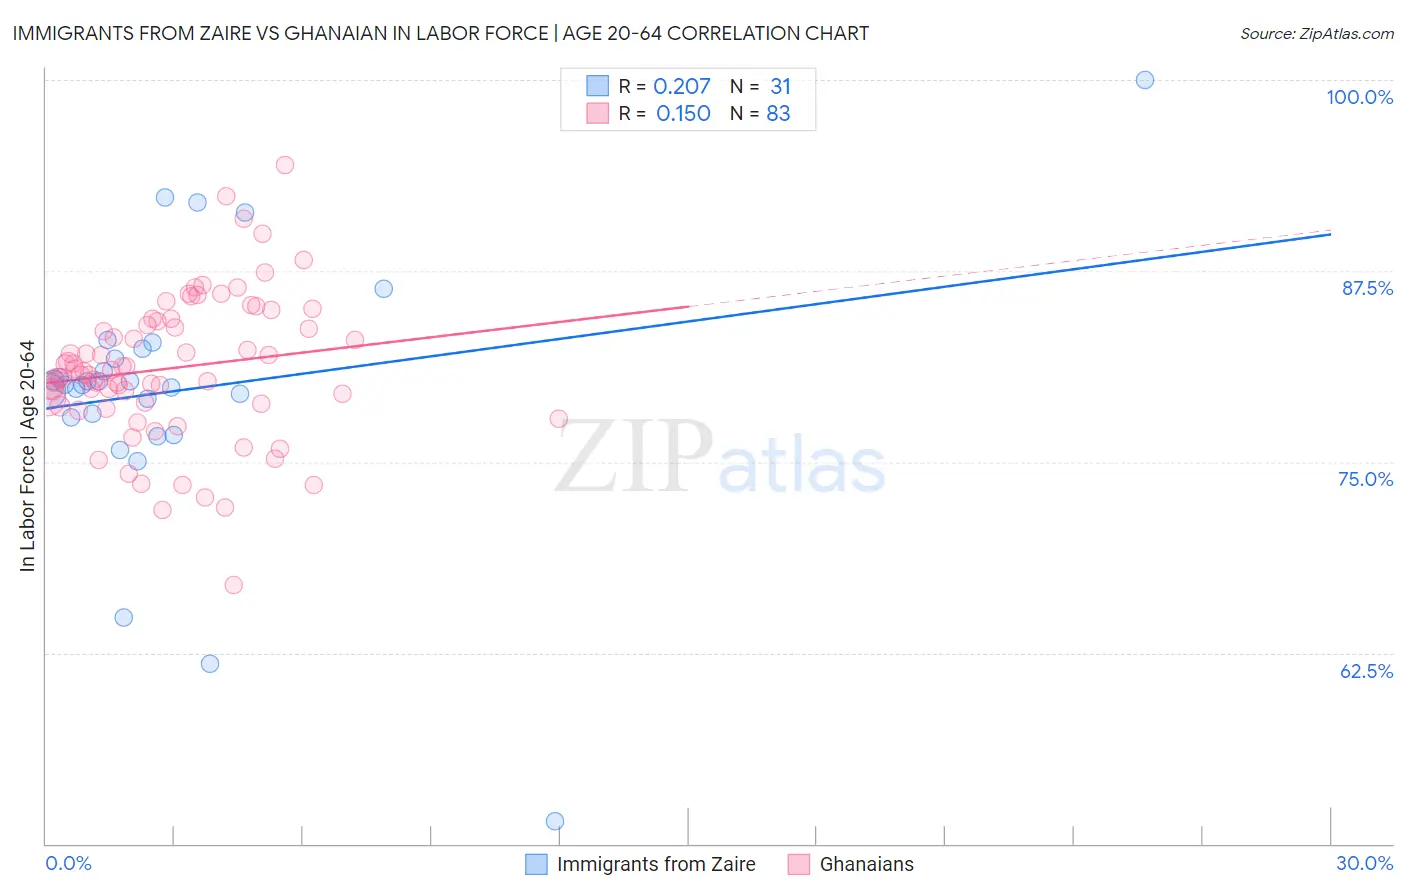
Immigrants from Zaire vs Ghanaian In Labor Force | Age 20-64 Correlation Chart
The statistical analysis conducted on geographies consisting of 107,255,436 people shows a weak positive correlation between the proportion of Immigrants from Zaire and labor force participation rate among population between the ages 20 and 64 in the United States with a correlation coefficient (R) of 0.207 and weighted average of 79.9%. Similarly, the statistical analysis conducted on geographies consisting of 190,721,874 people shows a poor positive correlation between the proportion of Ghanaians and labor force participation rate among population between the ages 20 and 64 in the United States with a correlation coefficient (R) of 0.150 and weighted average of 80.1%, a difference of 0.26%.
In Labor Force | Age 20-64 Correlation Summary
| Measurement | Immigrants from Zaire | Ghanaian |
| Minimum | 51.5% | 66.9% |
| Maximum | 100.0% | 94.4% |
| Range | 48.5% | 27.5% |
| Mean | 79.7% | 81.1% |
| Median | 80.0% | 80.9% |
| Interquartile 25% (IQ1) | 77.9% | 78.8% |
| Interquartile 75% (IQ3) | 82.4% | 84.2% |
| Interquartile Range (IQR) | 4.5% | 5.4% |
| Standard Deviation (Sample) | 8.8% | 4.7% |
| Standard Deviation (Population) | 8.7% | 4.7% |
Similar Demographics by In Labor Force | Age 20-64
Demographics Similar to Immigrants from Zaire by In Labor Force | Age 20-64
In terms of in labor force | age 20-64, the demographic groups most similar to Immigrants from Zaire are Italian (79.9%, a difference of 0.010%), Immigrants from Iran (79.9%, a difference of 0.010%), Immigrants from Czechoslovakia (79.9%, a difference of 0.020%), Immigrants from Eastern Asia (79.9%, a difference of 0.020%), and Indian (Asian) (79.9%, a difference of 0.020%).
| Demographics | Rating | Rank | In Labor Force | Age 20-64 |
| Immigrants | Russia | 91.8 /100 | #123 | Exceptional 79.9% |
| Immigrants | Europe | 91.6 /100 | #124 | Exceptional 79.9% |
| Danes | 91.5 /100 | #125 | Exceptional 79.9% |
| Immigrants | France | 90.7 /100 | #126 | Exceptional 79.9% |
| Immigrants | Czechoslovakia | 89.7 /100 | #127 | Excellent 79.9% |
| Immigrants | Eastern Asia | 89.4 /100 | #128 | Excellent 79.9% |
| Italians | 88.9 /100 | #129 | Excellent 79.9% |
| Immigrants | Zaire | 88.6 /100 | #130 | Excellent 79.9% |
| Immigrants | Iran | 88.3 /100 | #131 | Excellent 79.9% |
| Indians (Asian) | 87.7 /100 | #132 | Excellent 79.9% |
| South American Indians | 87.6 /100 | #133 | Excellent 79.9% |
| Belgians | 87.4 /100 | #134 | Excellent 79.9% |
| Ukrainians | 86.8 /100 | #135 | Excellent 79.9% |
| Immigrants | Singapore | 86.7 /100 | #136 | Excellent 79.9% |
| Immigrants | Ukraine | 86.5 /100 | #137 | Excellent 79.9% |
Demographics Similar to Ghanaians by In Labor Force | Age 20-64
In terms of in labor force | age 20-64, the demographic groups most similar to Ghanaians are Uruguayan (80.1%, a difference of 0.0%), Immigrants from Venezuela (80.1%, a difference of 0.010%), Polish (80.1%, a difference of 0.010%), Chilean (80.1%, a difference of 0.020%), and Immigrants from Belarus (80.1%, a difference of 0.020%).
| Demographics | Rating | Rank | In Labor Force | Age 20-64 |
| Jordanians | 97.2 /100 | #85 | Exceptional 80.1% |
| Immigrants | Egypt | 97.1 /100 | #86 | Exceptional 80.1% |
| Croatians | 97.1 /100 | #87 | Exceptional 80.1% |
| Chileans | 97.0 /100 | #88 | Exceptional 80.1% |
| Immigrants | Venezuela | 96.8 /100 | #89 | Exceptional 80.1% |
| Poles | 96.8 /100 | #90 | Exceptional 80.1% |
| Uruguayans | 96.7 /100 | #91 | Exceptional 80.1% |
| Ghanaians | 96.7 /100 | #92 | Exceptional 80.1% |
| Immigrants | Belarus | 96.4 /100 | #93 | Exceptional 80.1% |
| Immigrants | Asia | 96.0 /100 | #94 | Exceptional 80.1% |
| Yugoslavians | 95.9 /100 | #95 | Exceptional 80.1% |
| Immigrants | Malaysia | 95.9 /100 | #96 | Exceptional 80.1% |
| South Americans | 95.9 /100 | #97 | Exceptional 80.1% |
| Immigrants | Uruguay | 95.8 /100 | #98 | Exceptional 80.1% |
| Immigrants | Chile | 95.7 /100 | #99 | Exceptional 80.1% |