Immigrants from Zaire vs Icelander In Labor Force | Age 20-64
COMPARE
Immigrants from Zaire
Icelander
In Labor Force | Age 20-64
In Labor Force | Age 20-64 Comparison
Immigrants from Zaire
Icelanders
79.9%
IN LABOR FORCE | AGE 20-64
88.6/ 100
METRIC RATING
130th/ 347
METRIC RANK
79.7%
IN LABOR FORCE | AGE 20-64
75.1/ 100
METRIC RATING
149th/ 347
METRIC RANK
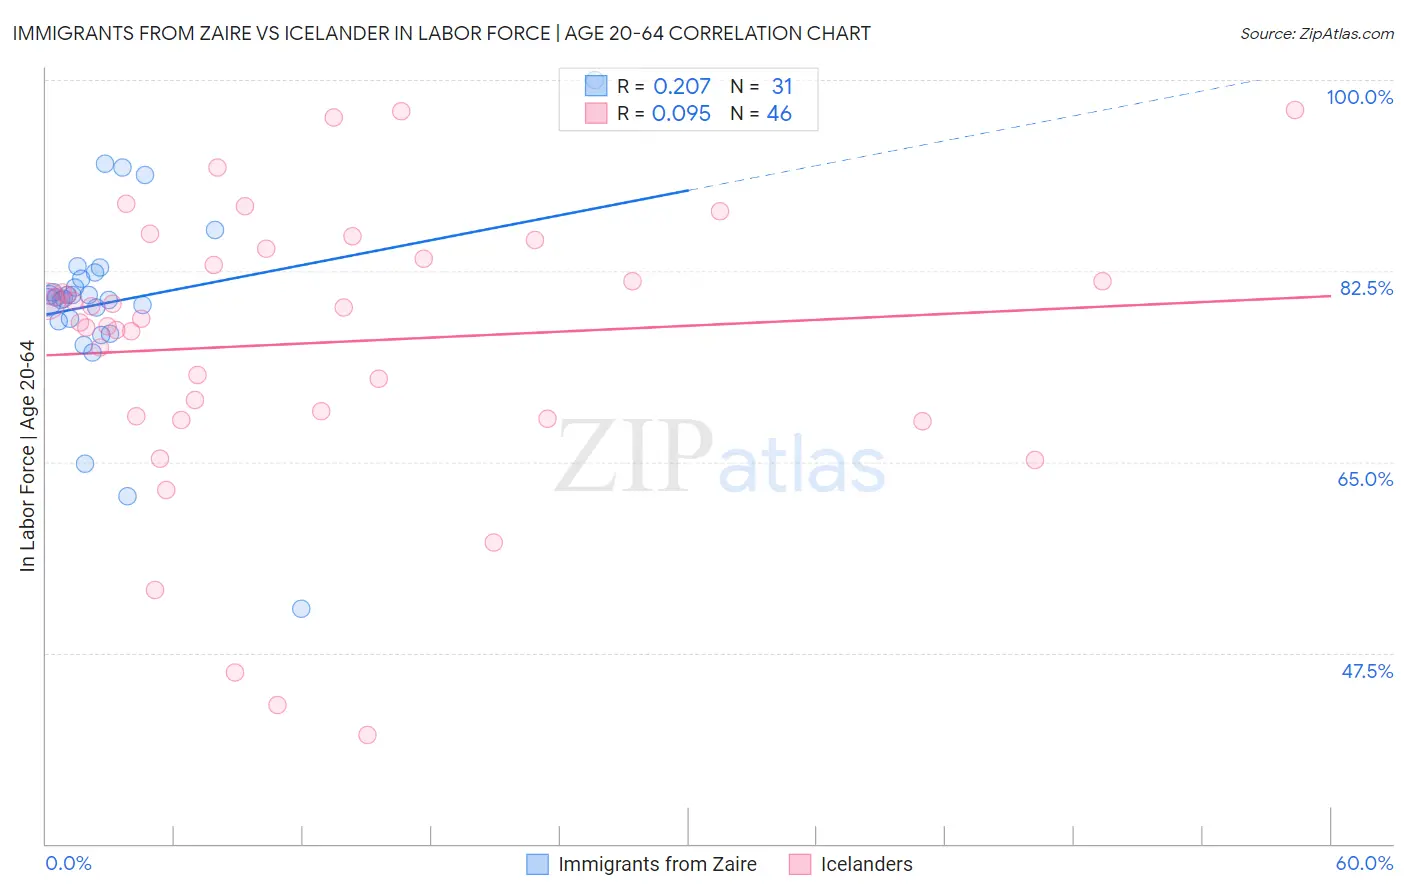
Immigrants from Zaire vs Icelander In Labor Force | Age 20-64 Correlation Chart
The statistical analysis conducted on geographies consisting of 107,255,436 people shows a weak positive correlation between the proportion of Immigrants from Zaire and labor force participation rate among population between the ages 20 and 64 in the United States with a correlation coefficient (R) of 0.207 and weighted average of 79.9%. Similarly, the statistical analysis conducted on geographies consisting of 159,668,592 people shows a slight positive correlation between the proportion of Icelanders and labor force participation rate among population between the ages 20 and 64 in the United States with a correlation coefficient (R) of 0.095 and weighted average of 79.7%, a difference of 0.19%.
In Labor Force | Age 20-64 Correlation Summary
| Measurement | Immigrants from Zaire | Icelander |
| Minimum | 51.5% | 40.0% |
| Maximum | 100.0% | 97.2% |
| Range | 48.5% | 57.2% |
| Mean | 79.7% | 75.9% |
| Median | 80.0% | 78.6% |
| Interquartile 25% (IQ1) | 77.9% | 69.2% |
| Interquartile 75% (IQ3) | 82.4% | 83.6% |
| Interquartile Range (IQR) | 4.5% | 14.4% |
| Standard Deviation (Sample) | 8.8% | 13.0% |
| Standard Deviation (Population) | 8.7% | 12.8% |
Demographics Similar to Immigrants from Zaire and Icelanders by In Labor Force | Age 20-64
In terms of in labor force | age 20-64, the demographic groups most similar to Immigrants from Zaire are Italian (79.9%, a difference of 0.010%), Immigrants from Iran (79.9%, a difference of 0.010%), Indian (Asian) (79.9%, a difference of 0.020%), South American Indian (79.9%, a difference of 0.020%), and Belgian (79.9%, a difference of 0.020%). Similarly, the demographic groups most similar to Icelanders are Immigrants from Philippines (79.8%, a difference of 0.030%), Romanian (79.8%, a difference of 0.030%), Immigrants from Southern Europe (79.8%, a difference of 0.040%), Immigrants from Sweden (79.8%, a difference of 0.050%), and Korean (79.8%, a difference of 0.050%).
| Demographics | Rating | Rank | In Labor Force | Age 20-64 |
| Italians | 88.9 /100 | #129 | Excellent 79.9% |
| Immigrants | Zaire | 88.6 /100 | #130 | Excellent 79.9% |
| Immigrants | Iran | 88.3 /100 | #131 | Excellent 79.9% |
| Indians (Asian) | 87.7 /100 | #132 | Excellent 79.9% |
| South American Indians | 87.6 /100 | #133 | Excellent 79.9% |
| Belgians | 87.4 /100 | #134 | Excellent 79.9% |
| Ukrainians | 86.8 /100 | #135 | Excellent 79.9% |
| Immigrants | Singapore | 86.7 /100 | #136 | Excellent 79.9% |
| Immigrants | Ukraine | 86.5 /100 | #137 | Excellent 79.9% |
| Immigrants | Nigeria | 86.4 /100 | #138 | Excellent 79.9% |
| Immigrants | Spain | 83.9 /100 | #139 | Excellent 79.8% |
| Immigrants | South Eastern Asia | 80.4 /100 | #140 | Excellent 79.8% |
| Immigrants | Israel | 80.0 /100 | #141 | Good 79.8% |
| Slovaks | 79.9 /100 | #142 | Good 79.8% |
| Immigrants | Sweden | 79.7 /100 | #143 | Good 79.8% |
| Koreans | 79.6 /100 | #144 | Good 79.8% |
| Pakistanis | 79.3 /100 | #145 | Good 79.8% |
| Immigrants | Southern Europe | 78.9 /100 | #146 | Good 79.8% |
| Immigrants | Philippines | 78.0 /100 | #147 | Good 79.8% |
| Romanians | 77.6 /100 | #148 | Good 79.8% |
| Icelanders | 75.1 /100 | #149 | Good 79.7% |