Immigrants from Zaire vs Potawatomi In Labor Force | Age 20-64
COMPARE
Immigrants from Zaire
Potawatomi
In Labor Force | Age 20-64
In Labor Force | Age 20-64 Comparison
Immigrants from Zaire
Potawatomi
79.9%
IN LABOR FORCE | AGE 20-64
88.6/ 100
METRIC RATING
130th/ 347
METRIC RANK
77.2%
IN LABOR FORCE | AGE 20-64
0.0/ 100
METRIC RATING
306th/ 347
METRIC RANK
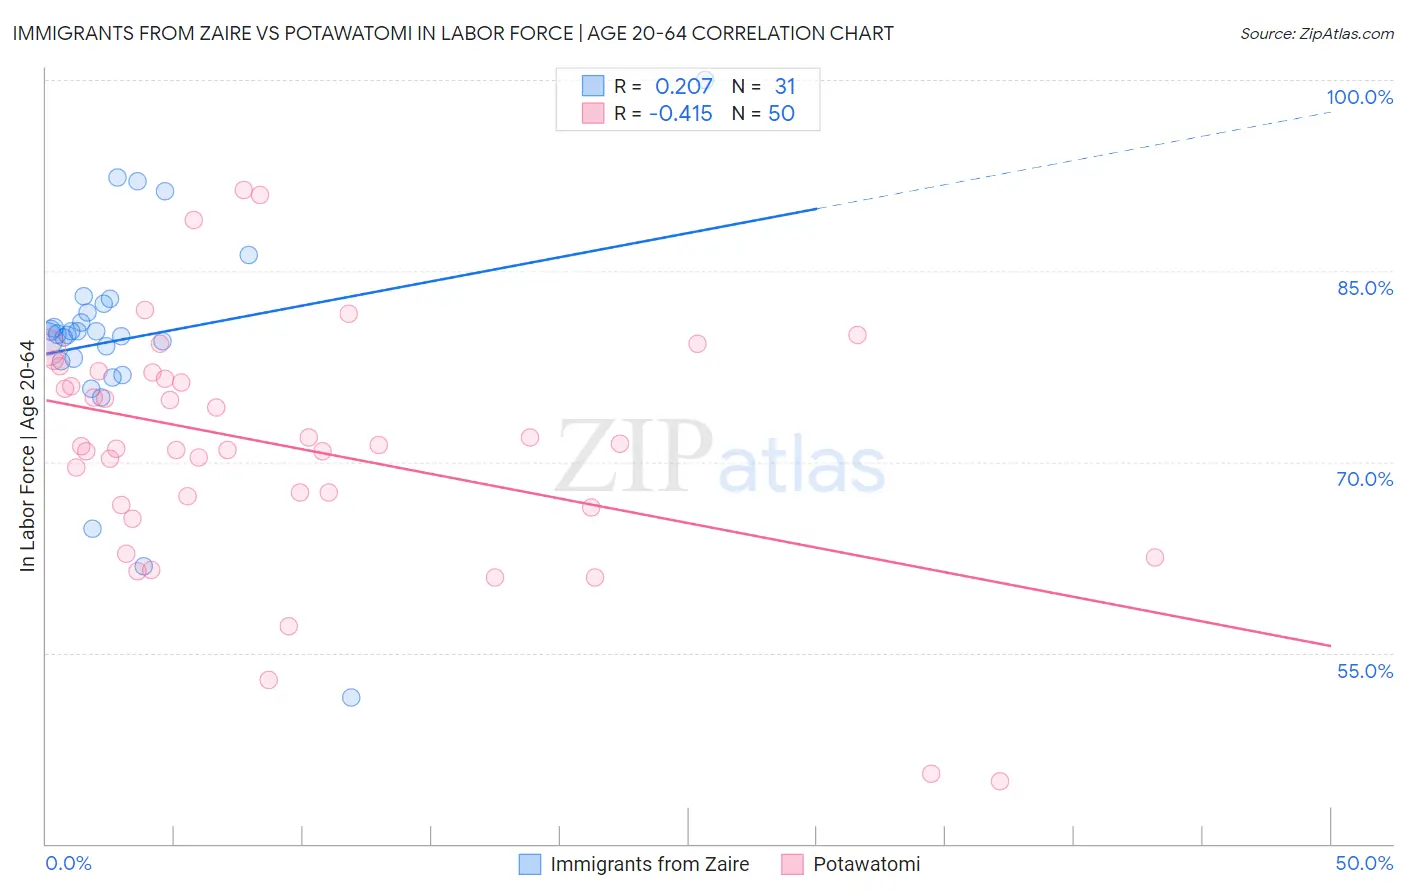
Immigrants from Zaire vs Potawatomi In Labor Force | Age 20-64 Correlation Chart
The statistical analysis conducted on geographies consisting of 107,255,436 people shows a weak positive correlation between the proportion of Immigrants from Zaire and labor force participation rate among population between the ages 20 and 64 in the United States with a correlation coefficient (R) of 0.207 and weighted average of 79.9%. Similarly, the statistical analysis conducted on geographies consisting of 117,773,870 people shows a moderate negative correlation between the proportion of Potawatomi and labor force participation rate among population between the ages 20 and 64 in the United States with a correlation coefficient (R) of -0.415 and weighted average of 77.2%, a difference of 3.5%.
In Labor Force | Age 20-64 Correlation Summary
| Measurement | Immigrants from Zaire | Potawatomi |
| Minimum | 51.5% | 44.9% |
| Maximum | 100.0% | 91.4% |
| Range | 48.5% | 46.5% |
| Mean | 79.7% | 71.2% |
| Median | 80.0% | 71.3% |
| Interquartile 25% (IQ1) | 77.9% | 66.7% |
| Interquartile 75% (IQ3) | 82.4% | 77.0% |
| Interquartile Range (IQR) | 4.5% | 10.4% |
| Standard Deviation (Sample) | 8.8% | 9.6% |
| Standard Deviation (Population) | 8.7% | 9.5% |
Similar Demographics by In Labor Force | Age 20-64
Demographics Similar to Immigrants from Zaire by In Labor Force | Age 20-64
In terms of in labor force | age 20-64, the demographic groups most similar to Immigrants from Zaire are Italian (79.9%, a difference of 0.010%), Immigrants from Iran (79.9%, a difference of 0.010%), Immigrants from Czechoslovakia (79.9%, a difference of 0.020%), Immigrants from Eastern Asia (79.9%, a difference of 0.020%), and Indian (Asian) (79.9%, a difference of 0.020%).
| Demographics | Rating | Rank | In Labor Force | Age 20-64 |
| Immigrants | Russia | 91.8 /100 | #123 | Exceptional 79.9% |
| Immigrants | Europe | 91.6 /100 | #124 | Exceptional 79.9% |
| Danes | 91.5 /100 | #125 | Exceptional 79.9% |
| Immigrants | France | 90.7 /100 | #126 | Exceptional 79.9% |
| Immigrants | Czechoslovakia | 89.7 /100 | #127 | Excellent 79.9% |
| Immigrants | Eastern Asia | 89.4 /100 | #128 | Excellent 79.9% |
| Italians | 88.9 /100 | #129 | Excellent 79.9% |
| Immigrants | Zaire | 88.6 /100 | #130 | Excellent 79.9% |
| Immigrants | Iran | 88.3 /100 | #131 | Excellent 79.9% |
| Indians (Asian) | 87.7 /100 | #132 | Excellent 79.9% |
| South American Indians | 87.6 /100 | #133 | Excellent 79.9% |
| Belgians | 87.4 /100 | #134 | Excellent 79.9% |
| Ukrainians | 86.8 /100 | #135 | Excellent 79.9% |
| Immigrants | Singapore | 86.7 /100 | #136 | Excellent 79.9% |
| Immigrants | Ukraine | 86.5 /100 | #137 | Excellent 79.9% |
Demographics Similar to Potawatomi by In Labor Force | Age 20-64
In terms of in labor force | age 20-64, the demographic groups most similar to Potawatomi are Mexican (77.2%, a difference of 0.020%), Immigrants from Mexico (77.3%, a difference of 0.060%), Chippewa (77.3%, a difference of 0.12%), Central American Indian (77.1%, a difference of 0.17%), and Alaska Native (77.0%, a difference of 0.23%).
| Demographics | Rating | Rank | In Labor Force | Age 20-64 |
| Hispanics or Latinos | 0.0 /100 | #299 | Tragic 77.6% |
| Spanish American Indians | 0.0 /100 | #300 | Tragic 77.6% |
| Nepalese | 0.0 /100 | #301 | Tragic 77.5% |
| Iroquois | 0.0 /100 | #302 | Tragic 77.5% |
| Chippewa | 0.0 /100 | #303 | Tragic 77.3% |
| Immigrants | Mexico | 0.0 /100 | #304 | Tragic 77.3% |
| Mexicans | 0.0 /100 | #305 | Tragic 77.2% |
| Potawatomi | 0.0 /100 | #306 | Tragic 77.2% |
| Central American Indians | 0.0 /100 | #307 | Tragic 77.1% |
| Alaska Natives | 0.0 /100 | #308 | Tragic 77.0% |
| Americans | 0.0 /100 | #309 | Tragic 77.0% |
| Comanche | 0.0 /100 | #310 | Tragic 77.0% |
| Blackfeet | 0.0 /100 | #311 | Tragic 77.0% |
| Alaskan Athabascans | 0.0 /100 | #312 | Tragic 76.9% |
| Shoshone | 0.0 /100 | #313 | Tragic 76.8% |