Immigrants from Zaire vs Immigrants In Labor Force | Age 20-24
COMPARE
Immigrants from Zaire
Immigrants
In Labor Force | Age 20-24
In Labor Force | Age 20-24 Comparison
Immigrants from Zaire
Immigrants
76.6%
IN LABOR FORCE | AGE 20-24
99.6/ 100
METRIC RATING
79th/ 347
METRIC RANK
74.1%
IN LABOR FORCE | AGE 20-24
3.6/ 100
METRIC RATING
234th/ 347
METRIC RANK
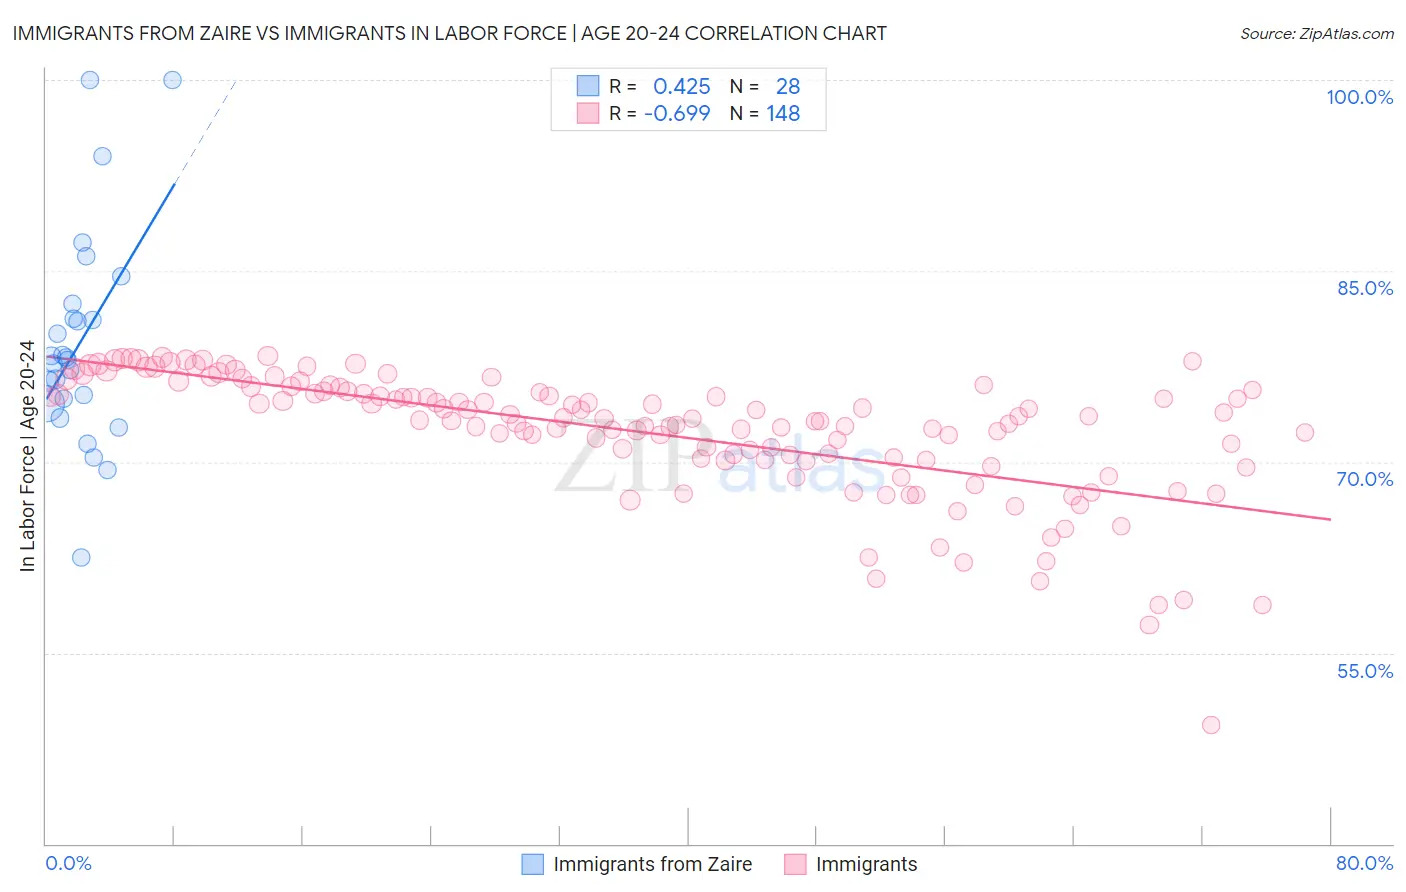
Immigrants from Zaire vs Immigrants In Labor Force | Age 20-24 Correlation Chart
The statistical analysis conducted on geographies consisting of 107,224,188 people shows a moderate positive correlation between the proportion of Immigrants from Zaire and labor force participation rate among population between the ages 20 and 24 in the United States with a correlation coefficient (R) of 0.425 and weighted average of 76.6%. Similarly, the statistical analysis conducted on geographies consisting of 576,110,803 people shows a significant negative correlation between the proportion of Immigrants and labor force participation rate among population between the ages 20 and 24 in the United States with a correlation coefficient (R) of -0.699 and weighted average of 74.1%, a difference of 3.3%.
In Labor Force | Age 20-24 Correlation Summary
| Measurement | Immigrants from Zaire | Immigrants |
| Minimum | 62.5% | 49.3% |
| Maximum | 100.0% | 78.3% |
| Range | 37.5% | 29.0% |
| Mean | 79.4% | 72.3% |
| Median | 78.1% | 73.4% |
| Interquartile 25% (IQ1) | 74.7% | 70.2% |
| Interquartile 75% (IQ3) | 81.8% | 75.6% |
| Interquartile Range (IQR) | 7.1% | 5.4% |
| Standard Deviation (Sample) | 8.4% | 5.0% |
| Standard Deviation (Population) | 8.3% | 5.0% |
Similar Demographics by In Labor Force | Age 20-24
Demographics Similar to Immigrants from Zaire by In Labor Force | Age 20-24
In terms of in labor force | age 20-24, the demographic groups most similar to Immigrants from Zaire are Immigrants from Cameroon (76.6%, a difference of 0.020%), Canadian (76.6%, a difference of 0.020%), Italian (76.5%, a difference of 0.030%), Basque (76.5%, a difference of 0.040%), and Hmong (76.5%, a difference of 0.040%).
| Demographics | Rating | Rank | In Labor Force | Age 20-24 |
| Guamanians/Chamorros | 99.8 /100 | #72 | Exceptional 76.7% |
| British | 99.8 /100 | #73 | Exceptional 76.7% |
| Cree | 99.7 /100 | #74 | Exceptional 76.6% |
| Immigrants | Middle Africa | 99.7 /100 | #75 | Exceptional 76.6% |
| Immigrants | Moldova | 99.6 /100 | #76 | Exceptional 76.6% |
| Immigrants | Cameroon | 99.6 /100 | #77 | Exceptional 76.6% |
| Canadians | 99.6 /100 | #78 | Exceptional 76.6% |
| Immigrants | Zaire | 99.6 /100 | #79 | Exceptional 76.6% |
| Italians | 99.6 /100 | #80 | Exceptional 76.5% |
| Basques | 99.5 /100 | #81 | Exceptional 76.5% |
| Hmong | 99.5 /100 | #82 | Exceptional 76.5% |
| Carpatho Rusyns | 99.4 /100 | #83 | Exceptional 76.5% |
| Austrians | 99.4 /100 | #84 | Exceptional 76.5% |
| Portuguese | 99.3 /100 | #85 | Exceptional 76.4% |
| Immigrants | Iraq | 99.3 /100 | #86 | Exceptional 76.4% |
Demographics Similar to Immigrants by In Labor Force | Age 20-24
In terms of in labor force | age 20-24, the demographic groups most similar to Immigrants are Immigrants from Chile (74.1%, a difference of 0.010%), Laotian (74.1%, a difference of 0.010%), Immigrants from France (74.1%, a difference of 0.030%), Bermudan (74.1%, a difference of 0.040%), and Immigrants from Switzerland (74.2%, a difference of 0.050%).
| Demographics | Rating | Rank | In Labor Force | Age 20-24 |
| Immigrants | Ireland | 5.8 /100 | #227 | Tragic 74.3% |
| Immigrants | Ukraine | 5.1 /100 | #228 | Tragic 74.2% |
| Immigrants | Sweden | 4.6 /100 | #229 | Tragic 74.2% |
| Immigrants | Albania | 4.3 /100 | #230 | Tragic 74.2% |
| Immigrants | Greece | 4.1 /100 | #231 | Tragic 74.2% |
| Immigrants | Switzerland | 4.1 /100 | #232 | Tragic 74.2% |
| Immigrants | Chile | 3.7 /100 | #233 | Tragic 74.1% |
| Immigrants | Immigrants | 3.6 /100 | #234 | Tragic 74.1% |
| Laotians | 3.5 /100 | #235 | Tragic 74.1% |
| Immigrants | France | 3.3 /100 | #236 | Tragic 74.1% |
| Bermudans | 3.2 /100 | #237 | Tragic 74.1% |
| Immigrants | Japan | 3.0 /100 | #238 | Tragic 74.1% |
| Immigrants | Latin America | 2.7 /100 | #239 | Tragic 74.1% |
| Immigrants | Sri Lanka | 2.3 /100 | #240 | Tragic 74.0% |
| Immigrants | Senegal | 2.1 /100 | #241 | Tragic 74.0% |