Immigrants from Zaire vs Arapaho In Labor Force | Age 20-24
COMPARE
Immigrants from Zaire
Arapaho
In Labor Force | Age 20-24
In Labor Force | Age 20-24 Comparison
Immigrants from Zaire
Arapaho
76.6%
IN LABOR FORCE | AGE 20-24
99.6/ 100
METRIC RATING
79th/ 347
METRIC RANK
73.8%
IN LABOR FORCE | AGE 20-24
1.0/ 100
METRIC RATING
253rd/ 347
METRIC RANK
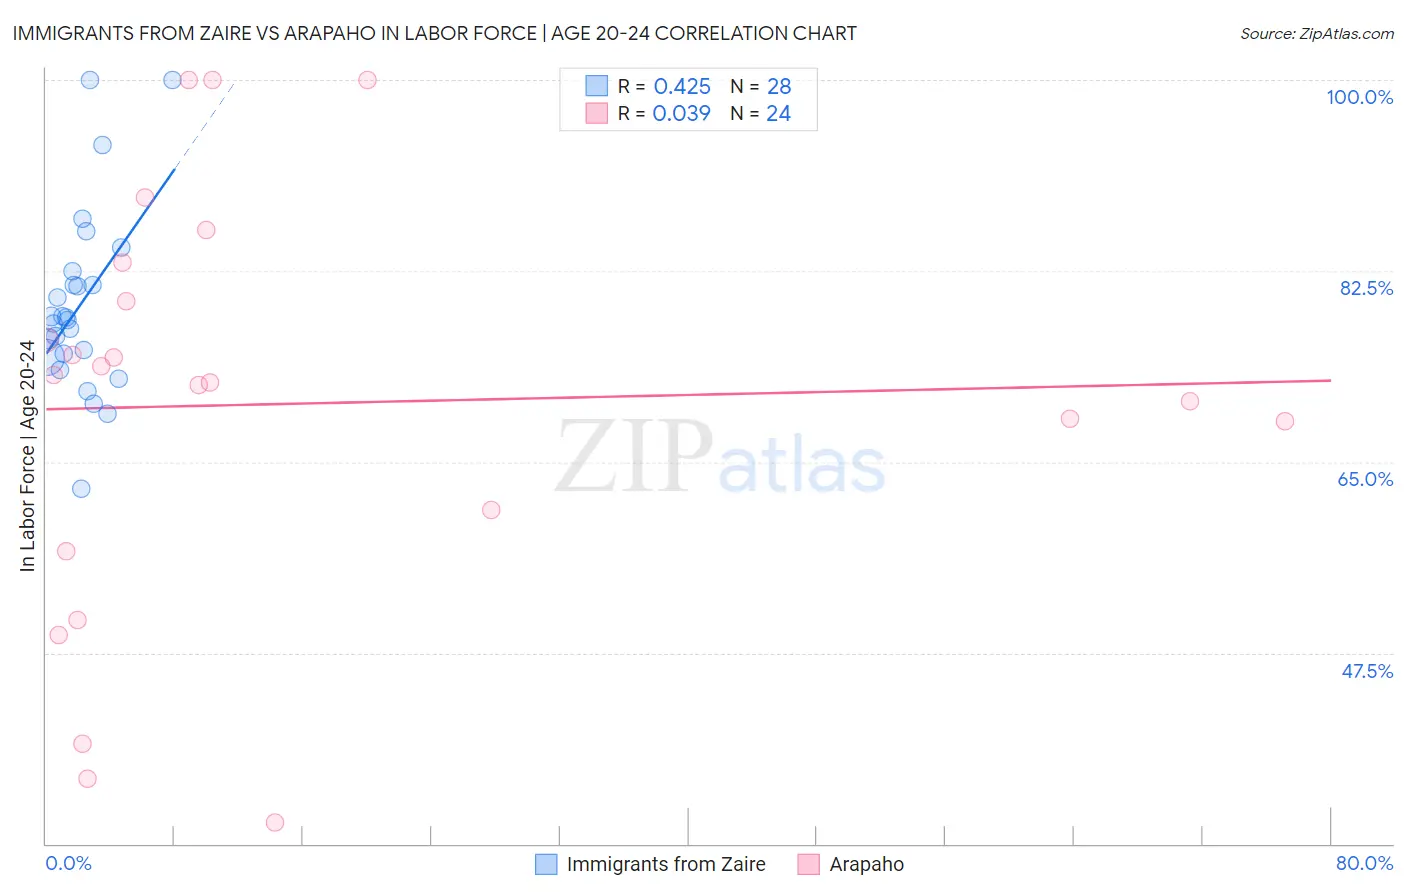
Immigrants from Zaire vs Arapaho In Labor Force | Age 20-24 Correlation Chart
The statistical analysis conducted on geographies consisting of 107,224,188 people shows a moderate positive correlation between the proportion of Immigrants from Zaire and labor force participation rate among population between the ages 20 and 24 in the United States with a correlation coefficient (R) of 0.425 and weighted average of 76.6%. Similarly, the statistical analysis conducted on geographies consisting of 29,774,764 people shows no correlation between the proportion of Arapaho and labor force participation rate among population between the ages 20 and 24 in the United States with a correlation coefficient (R) of 0.039 and weighted average of 73.8%, a difference of 3.8%.
In Labor Force | Age 20-24 Correlation Summary
| Measurement | Immigrants from Zaire | Arapaho |
| Minimum | 62.5% | 32.0% |
| Maximum | 100.0% | 100.0% |
| Range | 37.5% | 68.0% |
| Mean | 79.4% | 70.3% |
| Median | 78.1% | 72.6% |
| Interquartile 25% (IQ1) | 74.7% | 58.7% |
| Interquartile 75% (IQ3) | 81.8% | 81.5% |
| Interquartile Range (IQR) | 7.1% | 22.8% |
| Standard Deviation (Sample) | 8.4% | 19.0% |
| Standard Deviation (Population) | 8.3% | 18.6% |
Similar Demographics by In Labor Force | Age 20-24
Demographics Similar to Immigrants from Zaire by In Labor Force | Age 20-24
In terms of in labor force | age 20-24, the demographic groups most similar to Immigrants from Zaire are Immigrants from Cameroon (76.6%, a difference of 0.020%), Canadian (76.6%, a difference of 0.020%), Italian (76.5%, a difference of 0.030%), Basque (76.5%, a difference of 0.040%), and Hmong (76.5%, a difference of 0.040%).
| Demographics | Rating | Rank | In Labor Force | Age 20-24 |
| Guamanians/Chamorros | 99.8 /100 | #72 | Exceptional 76.7% |
| British | 99.8 /100 | #73 | Exceptional 76.7% |
| Cree | 99.7 /100 | #74 | Exceptional 76.6% |
| Immigrants | Middle Africa | 99.7 /100 | #75 | Exceptional 76.6% |
| Immigrants | Moldova | 99.6 /100 | #76 | Exceptional 76.6% |
| Immigrants | Cameroon | 99.6 /100 | #77 | Exceptional 76.6% |
| Canadians | 99.6 /100 | #78 | Exceptional 76.6% |
| Immigrants | Zaire | 99.6 /100 | #79 | Exceptional 76.6% |
| Italians | 99.6 /100 | #80 | Exceptional 76.5% |
| Basques | 99.5 /100 | #81 | Exceptional 76.5% |
| Hmong | 99.5 /100 | #82 | Exceptional 76.5% |
| Carpatho Rusyns | 99.4 /100 | #83 | Exceptional 76.5% |
| Austrians | 99.4 /100 | #84 | Exceptional 76.5% |
| Portuguese | 99.3 /100 | #85 | Exceptional 76.4% |
| Immigrants | Iraq | 99.3 /100 | #86 | Exceptional 76.4% |
Demographics Similar to Arapaho by In Labor Force | Age 20-24
In terms of in labor force | age 20-24, the demographic groups most similar to Arapaho are Ute (73.8%, a difference of 0.0%), Immigrants from Pakistan (73.8%, a difference of 0.030%), Immigrants from Kazakhstan (73.8%, a difference of 0.040%), Immigrants from Egypt (73.8%, a difference of 0.070%), and Spanish American Indian (73.7%, a difference of 0.070%).
| Demographics | Rating | Rank | In Labor Force | Age 20-24 |
| Immigrants | Panama | 1.6 /100 | #246 | Tragic 73.9% |
| Colville | 1.5 /100 | #247 | Tragic 73.9% |
| Immigrants | Saudi Arabia | 1.5 /100 | #248 | Tragic 73.9% |
| Blacks/African Americans | 1.3 /100 | #249 | Tragic 73.9% |
| Immigrants | Belgium | 1.3 /100 | #250 | Tragic 73.9% |
| Immigrants | Egypt | 1.2 /100 | #251 | Tragic 73.8% |
| Immigrants | Kazakhstan | 1.1 /100 | #252 | Tragic 73.8% |
| Arapaho | 1.0 /100 | #253 | Tragic 73.8% |
| Ute | 1.0 /100 | #254 | Tragic 73.8% |
| Immigrants | Pakistan | 0.9 /100 | #255 | Tragic 73.8% |
| Spanish American Indians | 0.8 /100 | #256 | Tragic 73.7% |
| Paraguayans | 0.8 /100 | #257 | Tragic 73.7% |
| Egyptians | 0.7 /100 | #258 | Tragic 73.7% |
| Dutch West Indians | 0.7 /100 | #259 | Tragic 73.7% |
| Immigrants | Turkey | 0.7 /100 | #260 | Tragic 73.7% |