Immigrants from Zaire vs Potawatomi In Labor Force | Age 30-34
COMPARE
Immigrants from Zaire
Potawatomi
In Labor Force | Age 30-34
In Labor Force | Age 30-34 Comparison
Immigrants from Zaire
Potawatomi
84.5%
IN LABOR FORCE | AGE 30-34
25.8/ 100
METRIC RATING
190th/ 347
METRIC RANK
82.8%
IN LABOR FORCE | AGE 30-34
0.0/ 100
METRIC RATING
291st/ 347
METRIC RANK
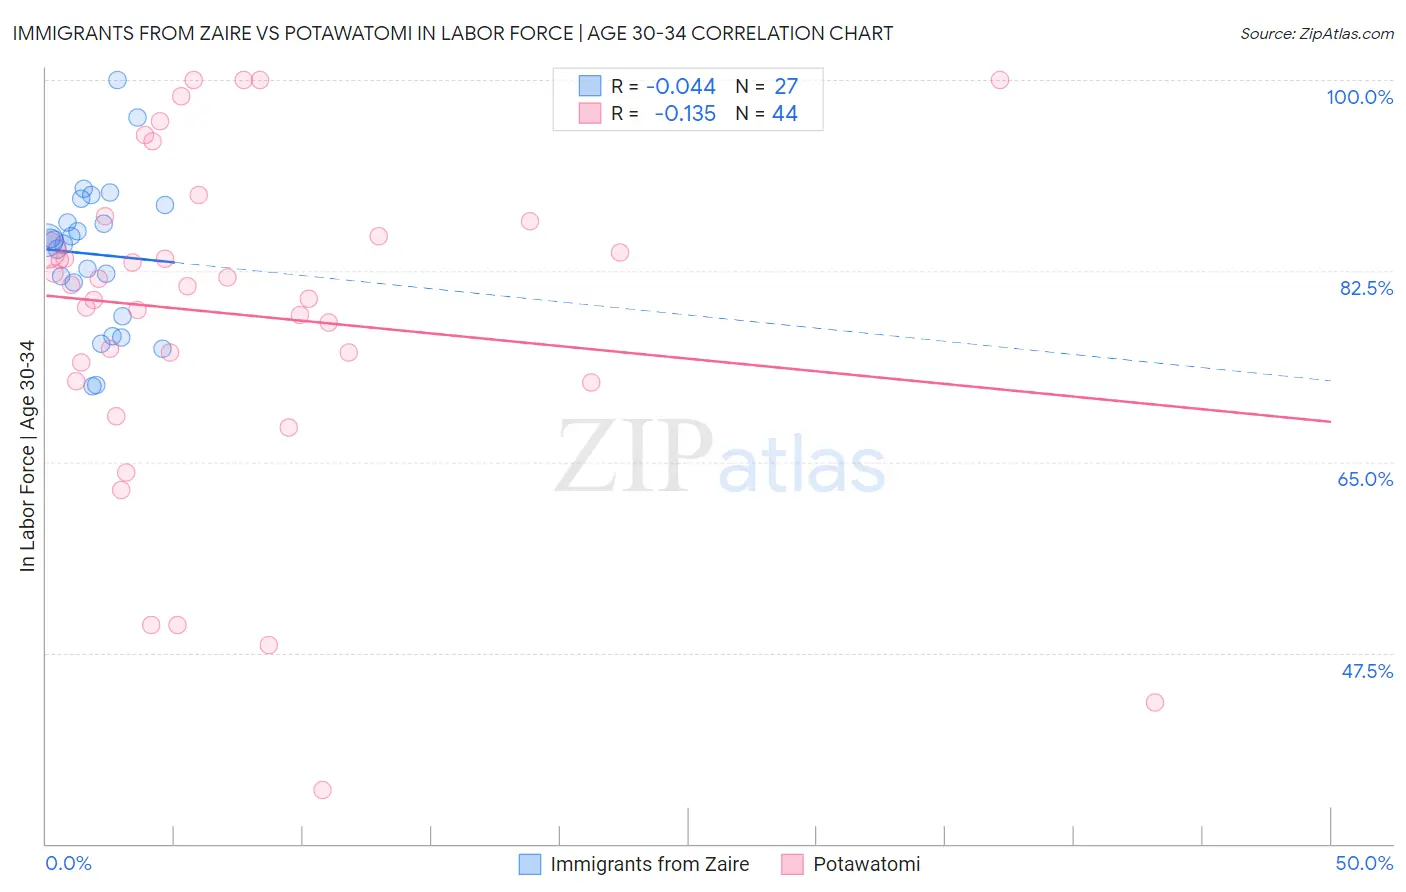
Immigrants from Zaire vs Potawatomi In Labor Force | Age 30-34 Correlation Chart
The statistical analysis conducted on geographies consisting of 107,239,554 people shows no correlation between the proportion of Immigrants from Zaire and labor force participation rate among population between the ages 30 and 34 in the United States with a correlation coefficient (R) of -0.044 and weighted average of 84.5%. Similarly, the statistical analysis conducted on geographies consisting of 117,760,740 people shows a poor negative correlation between the proportion of Potawatomi and labor force participation rate among population between the ages 30 and 34 in the United States with a correlation coefficient (R) of -0.135 and weighted average of 82.8%, a difference of 2.1%.
In Labor Force | Age 30-34 Correlation Summary
| Measurement | Immigrants from Zaire | Potawatomi |
| Minimum | 71.9% | 34.9% |
| Maximum | 100.0% | 100.0% |
| Range | 28.1% | 65.1% |
| Mean | 84.0% | 78.5% |
| Median | 85.3% | 81.2% |
| Interquartile 25% (IQ1) | 78.3% | 73.3% |
| Interquartile 75% (IQ3) | 88.5% | 86.4% |
| Interquartile Range (IQR) | 10.2% | 13.1% |
| Standard Deviation (Sample) | 6.7% | 15.3% |
| Standard Deviation (Population) | 6.6% | 15.2% |
Similar Demographics by In Labor Force | Age 30-34
Demographics Similar to Immigrants from Zaire by In Labor Force | Age 30-34
In terms of in labor force | age 30-34, the demographic groups most similar to Immigrants from Zaire are Hungarian (84.5%, a difference of 0.010%), Scandinavian (84.5%, a difference of 0.010%), Immigrants from Costa Rica (84.5%, a difference of 0.020%), Immigrants from Afghanistan (84.5%, a difference of 0.020%), and Korean (84.5%, a difference of 0.020%).
| Demographics | Rating | Rank | In Labor Force | Age 30-34 |
| Immigrants | Canada | 35.0 /100 | #183 | Fair 84.6% |
| Immigrants | North America | 33.3 /100 | #184 | Fair 84.6% |
| Immigrants | Philippines | 31.5 /100 | #185 | Fair 84.6% |
| Immigrants | Congo | 29.7 /100 | #186 | Fair 84.6% |
| Costa Ricans | 29.6 /100 | #187 | Fair 84.6% |
| Taiwanese | 29.4 /100 | #188 | Fair 84.6% |
| Nigerians | 28.9 /100 | #189 | Fair 84.5% |
| Immigrants | Zaire | 25.8 /100 | #190 | Fair 84.5% |
| Hungarians | 24.8 /100 | #191 | Fair 84.5% |
| Scandinavians | 24.7 /100 | #192 | Fair 84.5% |
| Immigrants | Costa Rica | 23.9 /100 | #193 | Fair 84.5% |
| Immigrants | Afghanistan | 23.5 /100 | #194 | Fair 84.5% |
| Koreans | 23.2 /100 | #195 | Fair 84.5% |
| British | 22.9 /100 | #196 | Fair 84.5% |
| Immigrants | Syria | 21.9 /100 | #197 | Fair 84.5% |
Demographics Similar to Potawatomi by In Labor Force | Age 30-34
In terms of in labor force | age 30-34, the demographic groups most similar to Potawatomi are Blackfeet (82.8%, a difference of 0.020%), Black/African American (82.8%, a difference of 0.020%), Nepalese (82.7%, a difference of 0.080%), American (82.7%, a difference of 0.11%), and Pennsylvania German (82.6%, a difference of 0.23%).
| Demographics | Rating | Rank | In Labor Force | Age 30-34 |
| Immigrants | Belize | 0.0 /100 | #284 | Tragic 83.2% |
| Cree | 0.0 /100 | #285 | Tragic 83.2% |
| Immigrants | Latin America | 0.0 /100 | #286 | Tragic 83.1% |
| Native Hawaiians | 0.0 /100 | #287 | Tragic 83.0% |
| Central American Indians | 0.0 /100 | #288 | Tragic 83.0% |
| Hawaiians | 0.0 /100 | #289 | Tragic 83.0% |
| Blackfeet | 0.0 /100 | #290 | Tragic 82.8% |
| Potawatomi | 0.0 /100 | #291 | Tragic 82.8% |
| Blacks/African Americans | 0.0 /100 | #292 | Tragic 82.8% |
| Nepalese | 0.0 /100 | #293 | Tragic 82.7% |
| Americans | 0.0 /100 | #294 | Tragic 82.7% |
| Pennsylvania Germans | 0.0 /100 | #295 | Tragic 82.6% |
| Chippewa | 0.0 /100 | #296 | Tragic 82.6% |
| Comanche | 0.0 /100 | #297 | Tragic 82.6% |
| Aleuts | 0.0 /100 | #298 | Tragic 82.6% |