Immigrants from Zaire vs Immigrants from West Indies In Labor Force | Age 30-34
COMPARE
Immigrants from Zaire
Immigrants from West Indies
In Labor Force | Age 30-34
In Labor Force | Age 30-34 Comparison
Immigrants from Zaire
Immigrants from West Indies
84.5%
IN LABOR FORCE | AGE 30-34
25.8/ 100
METRIC RATING
190th/ 347
METRIC RANK
84.5%
IN LABOR FORCE | AGE 30-34
18.1/ 100
METRIC RATING
202nd/ 347
METRIC RANK
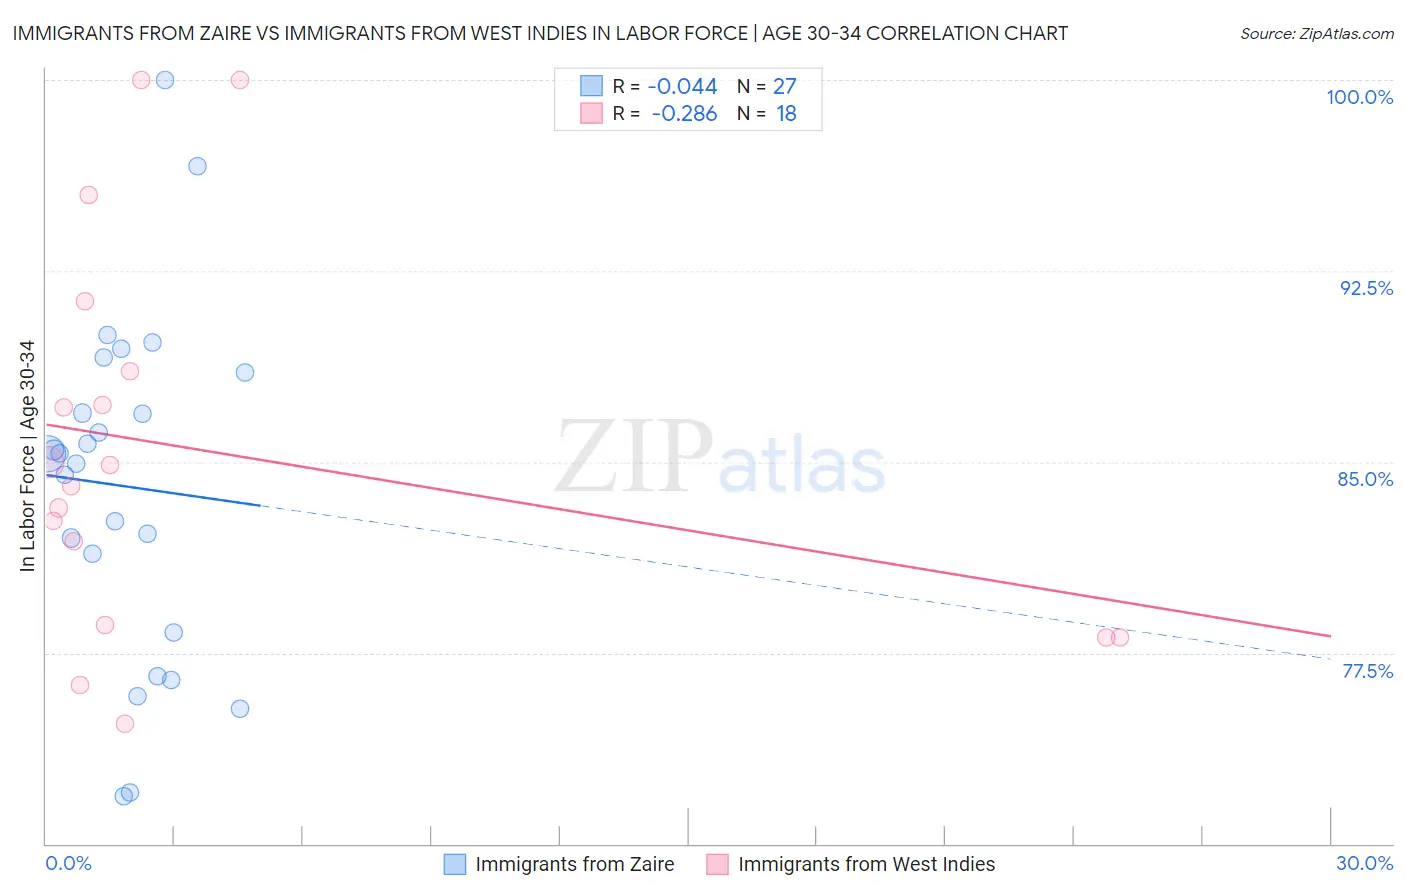
Immigrants from Zaire vs Immigrants from West Indies In Labor Force | Age 30-34 Correlation Chart
The statistical analysis conducted on geographies consisting of 107,239,554 people shows no correlation between the proportion of Immigrants from Zaire and labor force participation rate among population between the ages 30 and 34 in the United States with a correlation coefficient (R) of -0.044 and weighted average of 84.5%. Similarly, the statistical analysis conducted on geographies consisting of 72,450,455 people shows a weak negative correlation between the proportion of Immigrants from West Indies and labor force participation rate among population between the ages 30 and 34 in the United States with a correlation coefficient (R) of -0.286 and weighted average of 84.5%, a difference of 0.080%.
In Labor Force | Age 30-34 Correlation Summary
| Measurement | Immigrants from Zaire | Immigrants from West Indies |
| Minimum | 71.9% | 74.7% |
| Maximum | 100.0% | 100.0% |
| Range | 28.1% | 25.3% |
| Mean | 84.0% | 85.4% |
| Median | 85.3% | 84.5% |
| Interquartile 25% (IQ1) | 78.3% | 78.6% |
| Interquartile 75% (IQ3) | 88.5% | 88.6% |
| Interquartile Range (IQR) | 10.2% | 10.0% |
| Standard Deviation (Sample) | 6.7% | 7.5% |
| Standard Deviation (Population) | 6.6% | 7.3% |
Demographics Similar to Immigrants from Zaire and Immigrants from West Indies by In Labor Force | Age 30-34
In terms of in labor force | age 30-34, the demographic groups most similar to Immigrants from Zaire are Hungarian (84.5%, a difference of 0.010%), Scandinavian (84.5%, a difference of 0.010%), Immigrants from Costa Rica (84.5%, a difference of 0.020%), Immigrants from Afghanistan (84.5%, a difference of 0.020%), and Korean (84.5%, a difference of 0.020%). Similarly, the demographic groups most similar to Immigrants from West Indies are Trinidadian and Tobagonian (84.5%, a difference of 0.0%), Immigrants from Thailand (84.5%, a difference of 0.010%), Subsaharan African (84.5%, a difference of 0.010%), Dutch (84.5%, a difference of 0.020%), and Canadian (84.4%, a difference of 0.030%).
| Demographics | Rating | Rank | In Labor Force | Age 30-34 |
| Immigrants | Congo | 29.7 /100 | #186 | Fair 84.6% |
| Costa Ricans | 29.6 /100 | #187 | Fair 84.6% |
| Taiwanese | 29.4 /100 | #188 | Fair 84.6% |
| Nigerians | 28.9 /100 | #189 | Fair 84.5% |
| Immigrants | Zaire | 25.8 /100 | #190 | Fair 84.5% |
| Hungarians | 24.8 /100 | #191 | Fair 84.5% |
| Scandinavians | 24.7 /100 | #192 | Fair 84.5% |
| Immigrants | Costa Rica | 23.9 /100 | #193 | Fair 84.5% |
| Immigrants | Afghanistan | 23.5 /100 | #194 | Fair 84.5% |
| Koreans | 23.2 /100 | #195 | Fair 84.5% |
| British | 22.9 /100 | #196 | Fair 84.5% |
| Immigrants | Syria | 21.9 /100 | #197 | Fair 84.5% |
| Dutch | 20.2 /100 | #198 | Fair 84.5% |
| Immigrants | Thailand | 19.1 /100 | #199 | Poor 84.5% |
| Sub-Saharan Africans | 19.0 /100 | #200 | Poor 84.5% |
| Trinidadians and Tobagonians | 18.2 /100 | #201 | Poor 84.5% |
| Immigrants | West Indies | 18.1 /100 | #202 | Poor 84.5% |
| Canadians | 15.4 /100 | #203 | Poor 84.4% |
| Ecuadorians | 14.2 /100 | #204 | Poor 84.4% |
| French | 13.8 /100 | #205 | Poor 84.4% |
| Lebanese | 10.6 /100 | #206 | Poor 84.4% |