Immigrants from Zaire vs Afghan In Labor Force | Age 30-34
COMPARE
Immigrants from Zaire
Afghan
In Labor Force | Age 30-34
In Labor Force | Age 30-34 Comparison
Immigrants from Zaire
Afghans
84.5%
IN LABOR FORCE | AGE 30-34
25.8/ 100
METRIC RATING
190th/ 347
METRIC RANK
84.7%
IN LABOR FORCE | AGE 30-34
55.2/ 100
METRIC RATING
166th/ 347
METRIC RANK
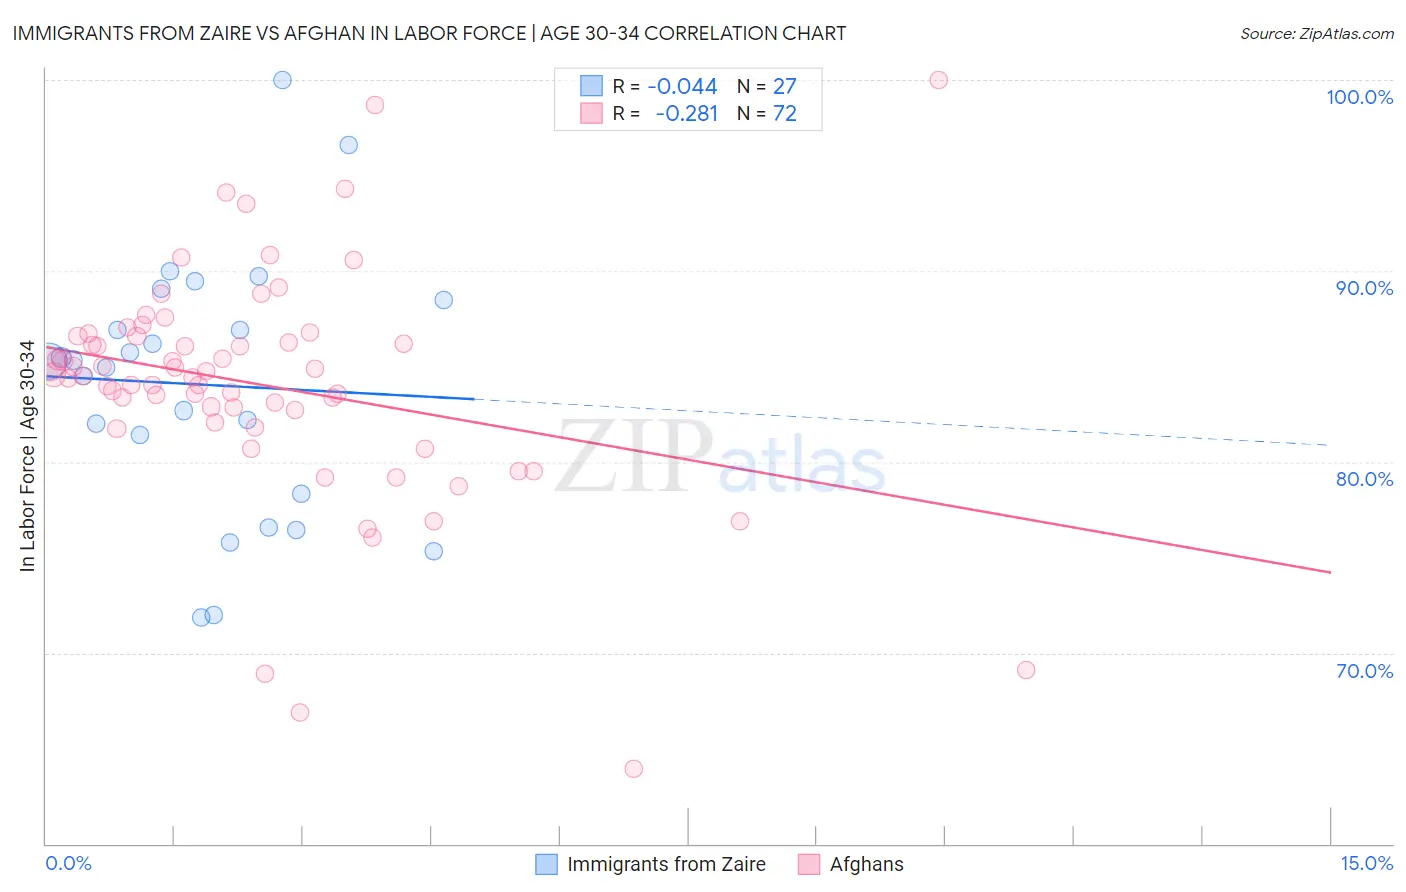
Immigrants from Zaire vs Afghan In Labor Force | Age 30-34 Correlation Chart
The statistical analysis conducted on geographies consisting of 107,239,554 people shows no correlation between the proportion of Immigrants from Zaire and labor force participation rate among population between the ages 30 and 34 in the United States with a correlation coefficient (R) of -0.044 and weighted average of 84.5%. Similarly, the statistical analysis conducted on geographies consisting of 148,857,099 people shows a weak negative correlation between the proportion of Afghans and labor force participation rate among population between the ages 30 and 34 in the United States with a correlation coefficient (R) of -0.281 and weighted average of 84.7%, a difference of 0.22%.
In Labor Force | Age 30-34 Correlation Summary
| Measurement | Immigrants from Zaire | Afghan |
| Minimum | 71.9% | 63.9% |
| Maximum | 100.0% | 100.0% |
| Range | 28.1% | 36.1% |
| Mean | 84.0% | 84.1% |
| Median | 85.3% | 84.5% |
| Interquartile 25% (IQ1) | 78.3% | 82.4% |
| Interquartile 75% (IQ3) | 88.5% | 86.6% |
| Interquartile Range (IQR) | 10.2% | 4.2% |
| Standard Deviation (Sample) | 6.7% | 6.1% |
| Standard Deviation (Population) | 6.6% | 6.0% |
Similar Demographics by In Labor Force | Age 30-34
Demographics Similar to Immigrants from Zaire by In Labor Force | Age 30-34
In terms of in labor force | age 30-34, the demographic groups most similar to Immigrants from Zaire are Hungarian (84.5%, a difference of 0.010%), Scandinavian (84.5%, a difference of 0.010%), Immigrants from Costa Rica (84.5%, a difference of 0.020%), Immigrants from Afghanistan (84.5%, a difference of 0.020%), and Korean (84.5%, a difference of 0.020%).
| Demographics | Rating | Rank | In Labor Force | Age 30-34 |
| Immigrants | Canada | 35.0 /100 | #183 | Fair 84.6% |
| Immigrants | North America | 33.3 /100 | #184 | Fair 84.6% |
| Immigrants | Philippines | 31.5 /100 | #185 | Fair 84.6% |
| Immigrants | Congo | 29.7 /100 | #186 | Fair 84.6% |
| Costa Ricans | 29.6 /100 | #187 | Fair 84.6% |
| Taiwanese | 29.4 /100 | #188 | Fair 84.6% |
| Nigerians | 28.9 /100 | #189 | Fair 84.5% |
| Immigrants | Zaire | 25.8 /100 | #190 | Fair 84.5% |
| Hungarians | 24.8 /100 | #191 | Fair 84.5% |
| Scandinavians | 24.7 /100 | #192 | Fair 84.5% |
| Immigrants | Costa Rica | 23.9 /100 | #193 | Fair 84.5% |
| Immigrants | Afghanistan | 23.5 /100 | #194 | Fair 84.5% |
| Koreans | 23.2 /100 | #195 | Fair 84.5% |
| British | 22.9 /100 | #196 | Fair 84.5% |
| Immigrants | Syria | 21.9 /100 | #197 | Fair 84.5% |
Demographics Similar to Afghans by In Labor Force | Age 30-34
In terms of in labor force | age 30-34, the demographic groups most similar to Afghans are Icelander (84.7%, a difference of 0.010%), Immigrants from Western Europe (84.7%, a difference of 0.010%), Immigrants from South Eastern Asia (84.7%, a difference of 0.010%), South American (84.7%, a difference of 0.020%), and Immigrants from Uruguay (84.7%, a difference of 0.020%).
| Demographics | Rating | Rank | In Labor Force | Age 30-34 |
| Czechoslovakians | 63.0 /100 | #159 | Good 84.8% |
| Pakistanis | 60.8 /100 | #160 | Good 84.7% |
| Immigrants | Cambodia | 60.7 /100 | #161 | Good 84.7% |
| South Americans | 58.7 /100 | #162 | Average 84.7% |
| Immigrants | Uruguay | 57.4 /100 | #163 | Average 84.7% |
| Icelanders | 56.8 /100 | #164 | Average 84.7% |
| Immigrants | Western Europe | 56.7 /100 | #165 | Average 84.7% |
| Afghans | 55.2 /100 | #166 | Average 84.7% |
| Immigrants | South Eastern Asia | 54.2 /100 | #167 | Average 84.7% |
| Immigrants | Peru | 52.4 /100 | #168 | Average 84.7% |
| South American Indians | 52.1 /100 | #169 | Average 84.7% |
| Immigrants | Burma/Myanmar | 52.0 /100 | #170 | Average 84.7% |
| Irish | 52.0 /100 | #171 | Average 84.7% |
| Immigrants | England | 51.7 /100 | #172 | Average 84.7% |
| Israelis | 51.1 /100 | #173 | Average 84.7% |