Immigrants from Zaire vs Immigrants from North America In Labor Force | Age 30-34
COMPARE
Immigrants from Zaire
Immigrants from North America
In Labor Force | Age 30-34
In Labor Force | Age 30-34 Comparison
Immigrants from Zaire
Immigrants from North America
84.5%
IN LABOR FORCE | AGE 30-34
25.8/ 100
METRIC RATING
190th/ 347
METRIC RANK
84.6%
IN LABOR FORCE | AGE 30-34
33.3/ 100
METRIC RATING
184th/ 347
METRIC RANK
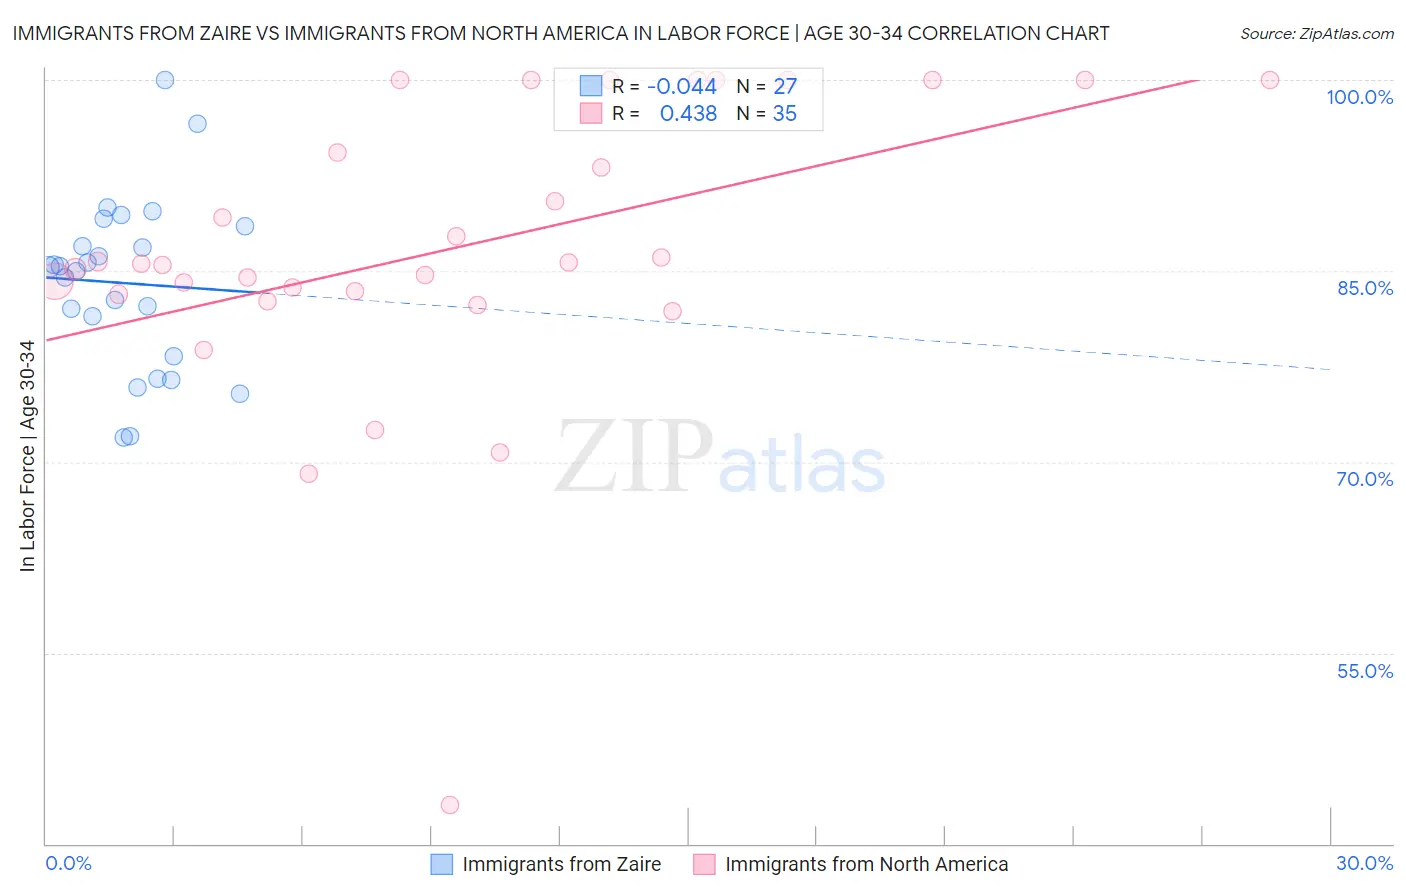
Immigrants from Zaire vs Immigrants from North America In Labor Force | Age 30-34 Correlation Chart
The statistical analysis conducted on geographies consisting of 107,239,554 people shows no correlation between the proportion of Immigrants from Zaire and labor force participation rate among population between the ages 30 and 34 in the United States with a correlation coefficient (R) of -0.044 and weighted average of 84.5%. Similarly, the statistical analysis conducted on geographies consisting of 462,059,236 people shows a moderate positive correlation between the proportion of Immigrants from North America and labor force participation rate among population between the ages 30 and 34 in the United States with a correlation coefficient (R) of 0.438 and weighted average of 84.6%, a difference of 0.060%.
In Labor Force | Age 30-34 Correlation Summary
| Measurement | Immigrants from Zaire | Immigrants from North America |
| Minimum | 71.9% | 43.1% |
| Maximum | 100.0% | 100.0% |
| Range | 28.1% | 56.9% |
| Mean | 84.0% | 86.8% |
| Median | 85.3% | 85.6% |
| Interquartile 25% (IQ1) | 78.3% | 83.2% |
| Interquartile 75% (IQ3) | 88.5% | 100.0% |
| Interquartile Range (IQR) | 10.2% | 16.8% |
| Standard Deviation (Sample) | 6.7% | 11.6% |
| Standard Deviation (Population) | 6.6% | 11.4% |
Demographics Similar to Immigrants from Zaire and Immigrants from North America by In Labor Force | Age 30-34
In terms of in labor force | age 30-34, the demographic groups most similar to Immigrants from Zaire are Hungarian (84.5%, a difference of 0.010%), Scandinavian (84.5%, a difference of 0.010%), Immigrants from Costa Rica (84.5%, a difference of 0.020%), Immigrants from Afghanistan (84.5%, a difference of 0.020%), and Korean (84.5%, a difference of 0.020%). Similarly, the demographic groups most similar to Immigrants from North America are Immigrants from Canada (84.6%, a difference of 0.010%), Immigrants from Philippines (84.6%, a difference of 0.010%), Barbadian (84.6%, a difference of 0.030%), Immigrants from Congo (84.6%, a difference of 0.030%), and Costa Rican (84.6%, a difference of 0.030%).
| Demographics | Rating | Rank | In Labor Force | Age 30-34 |
| Laotians | 46.9 /100 | #177 | Average 84.7% |
| Okinawans | 44.1 /100 | #178 | Average 84.6% |
| Immigrants | Nigeria | 42.5 /100 | #179 | Average 84.6% |
| Immigrants | Netherlands | 42.1 /100 | #180 | Average 84.6% |
| Moroccans | 40.3 /100 | #181 | Average 84.6% |
| Barbadians | 36.7 /100 | #182 | Fair 84.6% |
| Immigrants | Canada | 35.0 /100 | #183 | Fair 84.6% |
| Immigrants | North America | 33.3 /100 | #184 | Fair 84.6% |
| Immigrants | Philippines | 31.5 /100 | #185 | Fair 84.6% |
| Immigrants | Congo | 29.7 /100 | #186 | Fair 84.6% |
| Costa Ricans | 29.6 /100 | #187 | Fair 84.6% |
| Taiwanese | 29.4 /100 | #188 | Fair 84.6% |
| Nigerians | 28.9 /100 | #189 | Fair 84.5% |
| Immigrants | Zaire | 25.8 /100 | #190 | Fair 84.5% |
| Hungarians | 24.8 /100 | #191 | Fair 84.5% |
| Scandinavians | 24.7 /100 | #192 | Fair 84.5% |
| Immigrants | Costa Rica | 23.9 /100 | #193 | Fair 84.5% |
| Immigrants | Afghanistan | 23.5 /100 | #194 | Fair 84.5% |
| Koreans | 23.2 /100 | #195 | Fair 84.5% |
| British | 22.9 /100 | #196 | Fair 84.5% |
| Immigrants | Syria | 21.9 /100 | #197 | Fair 84.5% |