Immigrants from Western Europe vs Norwegian Unemployment Among Ages 55 to 59 years
COMPARE
Immigrants from Western Europe
Norwegian
Unemployment Among Ages 55 to 59 years
Unemployment Among Ages 55 to 59 years Comparison
Immigrants from Western Europe
Norwegians
4.8%
UNEMPLOYMENT AMONG AGES 55 TO 59 YEARS
60.4/ 100
METRIC RATING
167th/ 347
METRIC RANK
4.2%
UNEMPLOYMENT AMONG AGES 55 TO 59 YEARS
100.0/ 100
METRIC RATING
6th/ 347
METRIC RANK
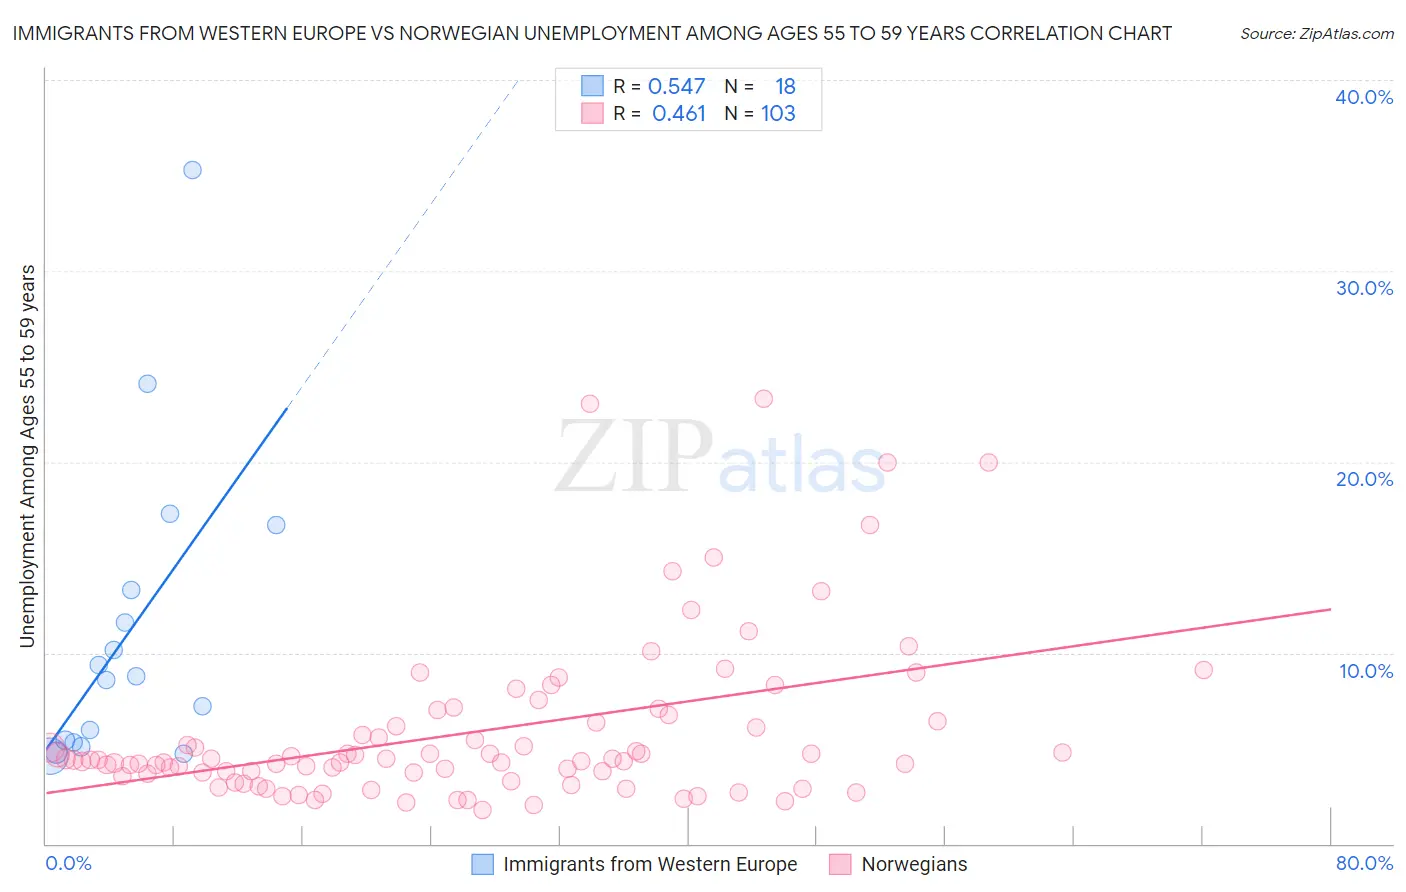
Immigrants from Western Europe vs Norwegian Unemployment Among Ages 55 to 59 years Correlation Chart
The statistical analysis conducted on geographies consisting of 444,129,393 people shows a substantial positive correlation between the proportion of Immigrants from Western Europe and unemployment rate among population between the ages 55 and 59 in the United States with a correlation coefficient (R) of 0.547 and weighted average of 4.8%. Similarly, the statistical analysis conducted on geographies consisting of 463,929,347 people shows a moderate positive correlation between the proportion of Norwegians and unemployment rate among population between the ages 55 and 59 in the United States with a correlation coefficient (R) of 0.461 and weighted average of 4.2%, a difference of 14.0%.
Unemployment Among Ages 55 to 59 years Correlation Summary
| Measurement | Immigrants from Western Europe | Norwegian |
| Minimum | 4.6% | 1.8% |
| Maximum | 35.3% | 23.3% |
| Range | 30.7% | 21.5% |
| Mean | 11.0% | 5.8% |
| Median | 8.7% | 4.4% |
| Interquartile 25% (IQ1) | 5.3% | 3.6% |
| Interquartile 75% (IQ3) | 13.3% | 6.4% |
| Interquartile Range (IQR) | 8.0% | 2.7% |
| Standard Deviation (Sample) | 8.1% | 4.3% |
| Standard Deviation (Population) | 7.9% | 4.3% |
Similar Demographics by Unemployment Among Ages 55 to 59 years
Demographics Similar to Immigrants from Western Europe by Unemployment Among Ages 55 to 59 years
In terms of unemployment among ages 55 to 59 years, the demographic groups most similar to Immigrants from Western Europe are Immigrants from Cambodia (4.8%, a difference of 0.040%), Immigrants from France (4.8%, a difference of 0.070%), Potawatomi (4.8%, a difference of 0.070%), Immigrants from Sudan (4.8%, a difference of 0.080%), and American (4.8%, a difference of 0.12%).
| Demographics | Rating | Rank | Unemployment Among Ages 55 to 59 years |
| Chickasaw | 65.1 /100 | #160 | Good 4.8% |
| Koreans | 64.6 /100 | #161 | Good 4.8% |
| Immigrants | Africa | 64.2 /100 | #162 | Good 4.8% |
| Immigrants | Lebanon | 63.8 /100 | #163 | Good 4.8% |
| Americans | 63.3 /100 | #164 | Good 4.8% |
| Immigrants | France | 62.0 /100 | #165 | Good 4.8% |
| Potawatomi | 62.0 /100 | #166 | Good 4.8% |
| Immigrants | Western Europe | 60.4 /100 | #167 | Good 4.8% |
| Immigrants | Cambodia | 59.3 /100 | #168 | Average 4.8% |
| Immigrants | Sudan | 58.4 /100 | #169 | Average 4.8% |
| Uruguayans | 55.6 /100 | #170 | Average 4.8% |
| Japanese | 54.5 /100 | #171 | Average 4.8% |
| Nicaraguans | 54.0 /100 | #172 | Average 4.8% |
| Immigrants | Eastern Europe | 52.2 /100 | #173 | Average 4.8% |
| Immigrants | Croatia | 50.0 /100 | #174 | Average 4.8% |
Demographics Similar to Norwegians by Unemployment Among Ages 55 to 59 years
In terms of unemployment among ages 55 to 59 years, the demographic groups most similar to Norwegians are Zimbabwean (4.2%, a difference of 0.57%), Immigrants from Bolivia (4.2%, a difference of 0.58%), Bolivian (4.2%, a difference of 0.68%), Cuban (4.2%, a difference of 0.80%), and Venezuelan (4.2%, a difference of 1.1%).
| Demographics | Rating | Rank | Unemployment Among Ages 55 to 59 years |
| Fijians | 100.0 /100 | #1 | Exceptional 4.1% |
| Immigrants | Cuba | 100.0 /100 | #2 | Exceptional 4.1% |
| Immigrants | Venezuela | 100.0 /100 | #3 | Exceptional 4.1% |
| Venezuelans | 100.0 /100 | #4 | Exceptional 4.2% |
| Immigrants | Bolivia | 100.0 /100 | #5 | Exceptional 4.2% |
| Norwegians | 100.0 /100 | #6 | Exceptional 4.2% |
| Zimbabweans | 100.0 /100 | #7 | Exceptional 4.2% |
| Bolivians | 100.0 /100 | #8 | Exceptional 4.2% |
| Cubans | 100.0 /100 | #9 | Exceptional 4.2% |
| Tongans | 100.0 /100 | #10 | Exceptional 4.3% |
| Immigrants | Congo | 100.0 /100 | #11 | Exceptional 4.3% |
| Danes | 100.0 /100 | #12 | Exceptional 4.3% |
| Indonesians | 100.0 /100 | #13 | Exceptional 4.3% |
| Immigrants | India | 100.0 /100 | #14 | Exceptional 4.3% |
| Bulgarians | 100.0 /100 | #15 | Exceptional 4.3% |