Immigrants from Western Asia vs Immigrants from Scotland In Labor Force | Age 20-64
COMPARE
Immigrants from Western Asia
Immigrants from Scotland
In Labor Force | Age 20-64
In Labor Force | Age 20-64 Comparison
Immigrants from Western Asia
Immigrants from Scotland
79.2%
IN LABOR FORCE | AGE 20-64
11.0/ 100
METRIC RATING
217th/ 347
METRIC RANK
79.6%
IN LABOR FORCE | AGE 20-64
52.4/ 100
METRIC RATING
173rd/ 347
METRIC RANK
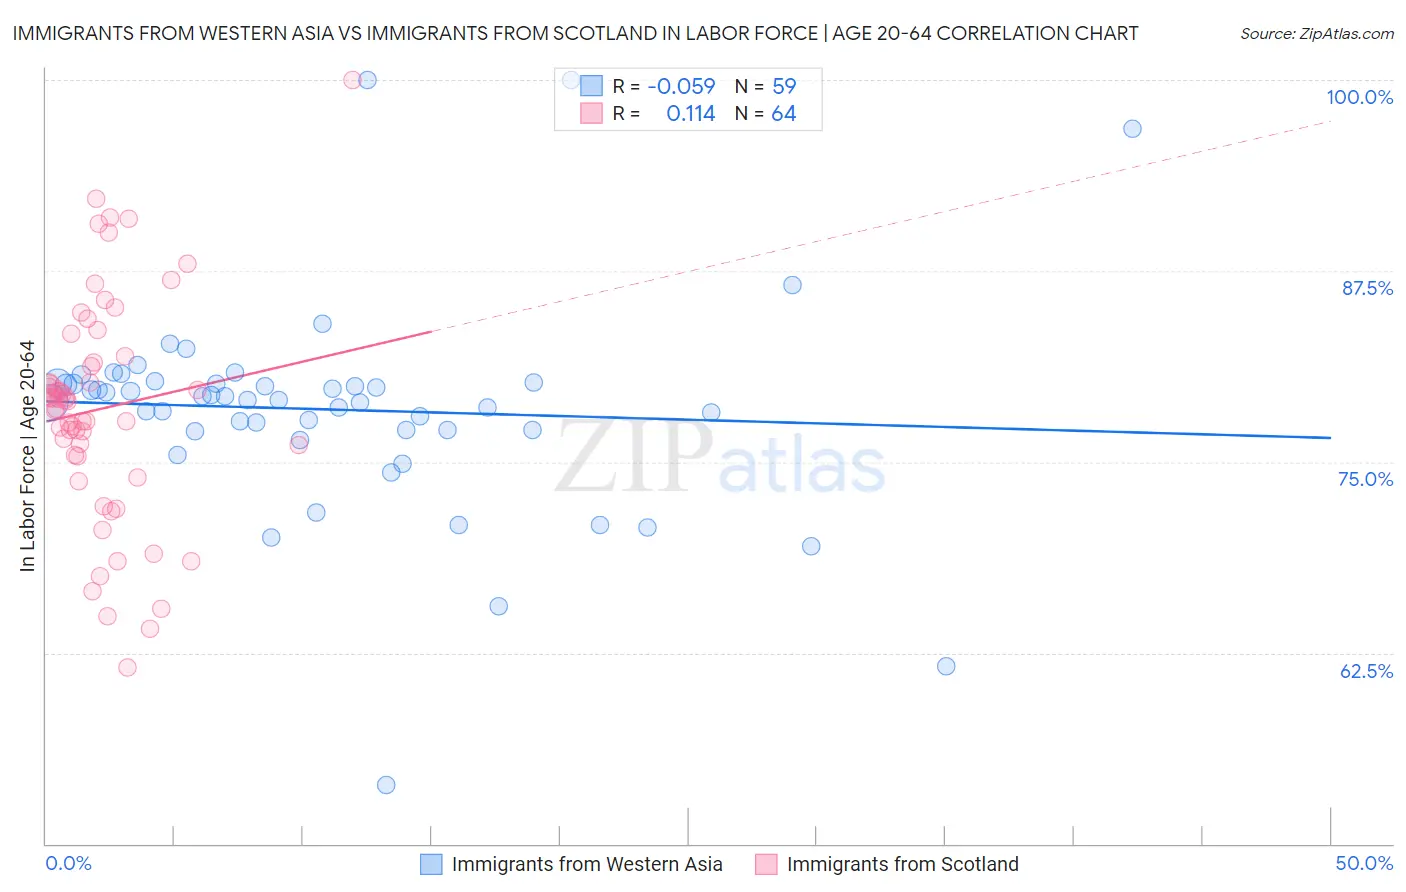
Immigrants from Western Asia vs Immigrants from Scotland In Labor Force | Age 20-64 Correlation Chart
The statistical analysis conducted on geographies consisting of 404,437,919 people shows a slight negative correlation between the proportion of Immigrants from Western Asia and labor force participation rate among population between the ages 20 and 64 in the United States with a correlation coefficient (R) of -0.059 and weighted average of 79.2%. Similarly, the statistical analysis conducted on geographies consisting of 196,399,264 people shows a poor positive correlation between the proportion of Immigrants from Scotland and labor force participation rate among population between the ages 20 and 64 in the United States with a correlation coefficient (R) of 0.114 and weighted average of 79.6%, a difference of 0.44%.
In Labor Force | Age 20-64 Correlation Summary
| Measurement | Immigrants from Western Asia | Immigrants from Scotland |
| Minimum | 53.8% | 61.5% |
| Maximum | 100.0% | 100.0% |
| Range | 46.2% | 38.5% |
| Mean | 78.4% | 78.5% |
| Median | 79.1% | 79.0% |
| Interquartile 25% (IQ1) | 77.1% | 75.4% |
| Interquartile 75% (IQ3) | 80.2% | 81.7% |
| Interquartile Range (IQR) | 3.1% | 6.3% |
| Standard Deviation (Sample) | 7.1% | 7.4% |
| Standard Deviation (Population) | 7.1% | 7.3% |
Similar Demographics by In Labor Force | Age 20-64
Demographics Similar to Immigrants from Western Asia by In Labor Force | Age 20-64
In terms of in labor force | age 20-64, the demographic groups most similar to Immigrants from Western Asia are Arab (79.2%, a difference of 0.010%), Immigrants from Armenia (79.2%, a difference of 0.020%), Immigrants from Norway (79.2%, a difference of 0.020%), Immigrants from Portugal (79.3%, a difference of 0.030%), and Irish (79.3%, a difference of 0.040%).
| Demographics | Rating | Rank | In Labor Force | Age 20-64 |
| Haitians | 16.1 /100 | #210 | Poor 79.3% |
| Europeans | 15.3 /100 | #211 | Poor 79.3% |
| Irish | 13.2 /100 | #212 | Poor 79.3% |
| Immigrants | Portugal | 12.8 /100 | #213 | Poor 79.3% |
| Immigrants | Armenia | 12.2 /100 | #214 | Poor 79.2% |
| Immigrants | Norway | 12.0 /100 | #215 | Poor 79.2% |
| Arabs | 11.4 /100 | #216 | Poor 79.2% |
| Immigrants | Western Asia | 11.0 /100 | #217 | Poor 79.2% |
| Immigrants | England | 9.3 /100 | #218 | Tragic 79.2% |
| French Canadians | 8.4 /100 | #219 | Tragic 79.2% |
| Immigrants | Immigrants | 7.7 /100 | #220 | Tragic 79.2% |
| Hungarians | 7.2 /100 | #221 | Tragic 79.2% |
| Immigrants | Panama | 6.9 /100 | #222 | Tragic 79.1% |
| Canadians | 6.8 /100 | #223 | Tragic 79.1% |
| Immigrants | Uzbekistan | 6.8 /100 | #224 | Tragic 79.1% |
Demographics Similar to Immigrants from Scotland by In Labor Force | Age 20-64
In terms of in labor force | age 20-64, the demographic groups most similar to Immigrants from Scotland are Slavic (79.6%, a difference of 0.010%), Immigrants from Switzerland (79.6%, a difference of 0.010%), Immigrants from Belgium (79.6%, a difference of 0.010%), Syrian (79.6%, a difference of 0.020%), and Laotian (79.6%, a difference of 0.050%).
| Demographics | Rating | Rank | In Labor Force | Age 20-64 |
| Okinawans | 62.7 /100 | #166 | Good 79.6% |
| Immigrants | Iraq | 62.0 /100 | #167 | Good 79.6% |
| Immigrants | Indonesia | 61.8 /100 | #168 | Good 79.6% |
| Laotians | 58.4 /100 | #169 | Average 79.6% |
| Slavs | 54.0 /100 | #170 | Average 79.6% |
| Immigrants | Switzerland | 53.3 /100 | #171 | Average 79.6% |
| Immigrants | Belgium | 53.1 /100 | #172 | Average 79.6% |
| Immigrants | Scotland | 52.4 /100 | #173 | Average 79.6% |
| Syrians | 50.0 /100 | #174 | Average 79.6% |
| Cubans | 46.1 /100 | #175 | Average 79.5% |
| Australians | 46.0 /100 | #176 | Average 79.5% |
| Immigrants | Netherlands | 45.2 /100 | #177 | Average 79.5% |
| Czechoslovakians | 44.3 /100 | #178 | Average 79.5% |
| Armenians | 41.4 /100 | #179 | Average 79.5% |
| Salvadorans | 41.0 /100 | #180 | Average 79.5% |