Immigrants from Western Asia vs Trinidadian and Tobagonian In Labor Force | Age 20-64
COMPARE
Immigrants from Western Asia
Trinidadian and Tobagonian
In Labor Force | Age 20-64
In Labor Force | Age 20-64 Comparison
Immigrants from Western Asia
Trinidadians and Tobagonians
79.2%
IN LABOR FORCE | AGE 20-64
11.0/ 100
METRIC RATING
217th/ 347
METRIC RANK
79.0%
IN LABOR FORCE | AGE 20-64
2.3/ 100
METRIC RATING
240th/ 347
METRIC RANK
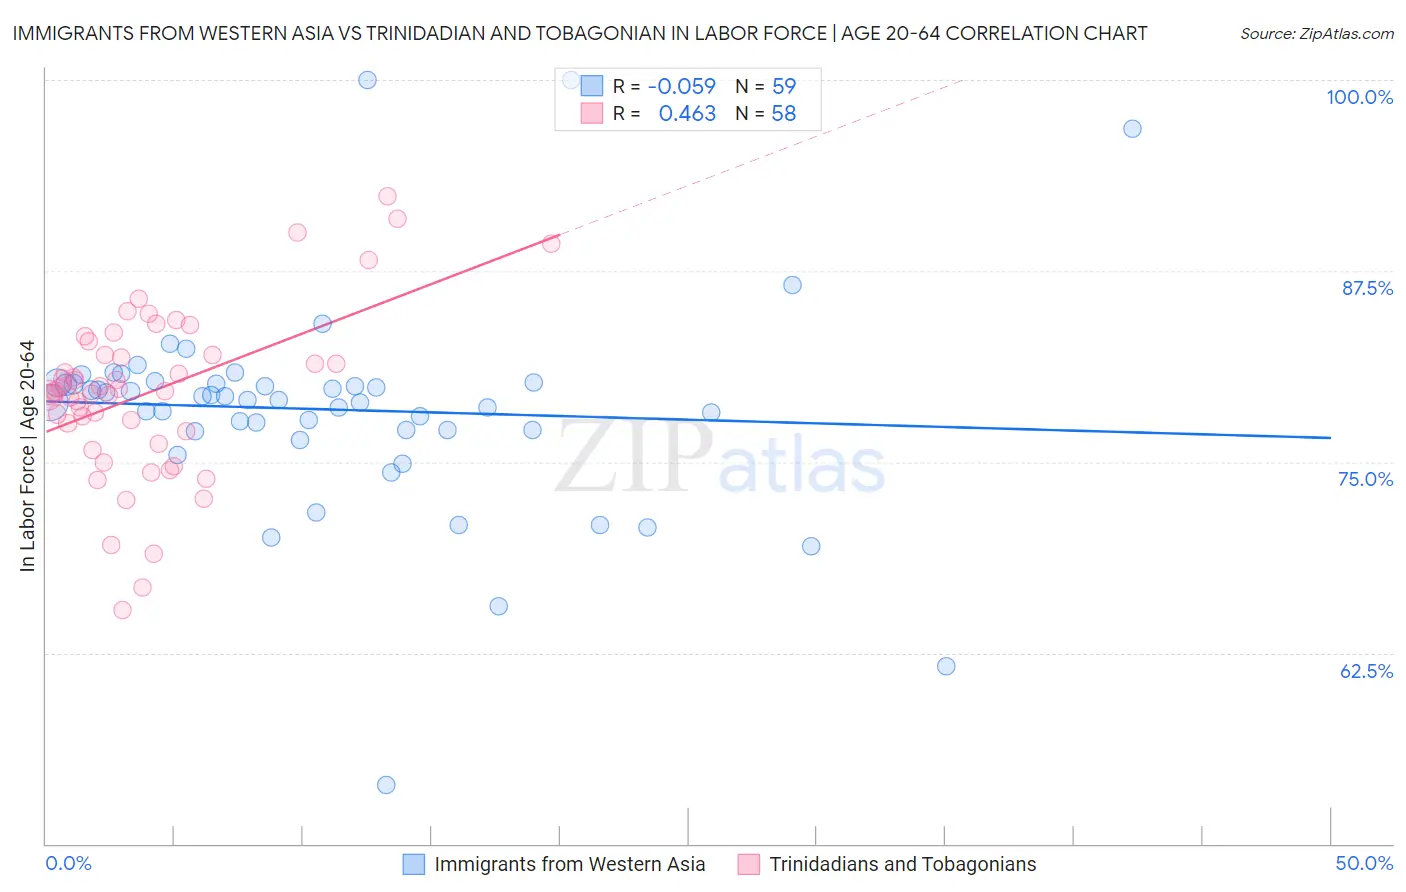
Immigrants from Western Asia vs Trinidadian and Tobagonian In Labor Force | Age 20-64 Correlation Chart
The statistical analysis conducted on geographies consisting of 404,437,919 people shows a slight negative correlation between the proportion of Immigrants from Western Asia and labor force participation rate among population between the ages 20 and 64 in the United States with a correlation coefficient (R) of -0.059 and weighted average of 79.2%. Similarly, the statistical analysis conducted on geographies consisting of 219,883,468 people shows a moderate positive correlation between the proportion of Trinidadians and Tobagonians and labor force participation rate among population between the ages 20 and 64 in the United States with a correlation coefficient (R) of 0.463 and weighted average of 79.0%, a difference of 0.33%.
In Labor Force | Age 20-64 Correlation Summary
| Measurement | Immigrants from Western Asia | Trinidadian and Tobagonian |
| Minimum | 53.8% | 65.3% |
| Maximum | 100.0% | 92.4% |
| Range | 46.2% | 27.1% |
| Mean | 78.4% | 79.5% |
| Median | 79.1% | 79.6% |
| Interquartile 25% (IQ1) | 77.1% | 77.0% |
| Interquartile 75% (IQ3) | 80.2% | 82.0% |
| Interquartile Range (IQR) | 3.1% | 5.0% |
| Standard Deviation (Sample) | 7.1% | 5.4% |
| Standard Deviation (Population) | 7.1% | 5.4% |
Similar Demographics by In Labor Force | Age 20-64
Demographics Similar to Immigrants from Western Asia by In Labor Force | Age 20-64
In terms of in labor force | age 20-64, the demographic groups most similar to Immigrants from Western Asia are Arab (79.2%, a difference of 0.010%), Immigrants from Armenia (79.2%, a difference of 0.020%), Immigrants from Norway (79.2%, a difference of 0.020%), Immigrants from Portugal (79.3%, a difference of 0.030%), and Irish (79.3%, a difference of 0.040%).
| Demographics | Rating | Rank | In Labor Force | Age 20-64 |
| Haitians | 16.1 /100 | #210 | Poor 79.3% |
| Europeans | 15.3 /100 | #211 | Poor 79.3% |
| Irish | 13.2 /100 | #212 | Poor 79.3% |
| Immigrants | Portugal | 12.8 /100 | #213 | Poor 79.3% |
| Immigrants | Armenia | 12.2 /100 | #214 | Poor 79.2% |
| Immigrants | Norway | 12.0 /100 | #215 | Poor 79.2% |
| Arabs | 11.4 /100 | #216 | Poor 79.2% |
| Immigrants | Western Asia | 11.0 /100 | #217 | Poor 79.2% |
| Immigrants | England | 9.3 /100 | #218 | Tragic 79.2% |
| French Canadians | 8.4 /100 | #219 | Tragic 79.2% |
| Immigrants | Immigrants | 7.7 /100 | #220 | Tragic 79.2% |
| Hungarians | 7.2 /100 | #221 | Tragic 79.2% |
| Immigrants | Panama | 6.9 /100 | #222 | Tragic 79.1% |
| Canadians | 6.8 /100 | #223 | Tragic 79.1% |
| Immigrants | Uzbekistan | 6.8 /100 | #224 | Tragic 79.1% |
Demographics Similar to Trinidadians and Tobagonians by In Labor Force | Age 20-64
In terms of in labor force | age 20-64, the demographic groups most similar to Trinidadians and Tobagonians are Welsh (79.0%, a difference of 0.010%), Immigrants from Jamaica (79.0%, a difference of 0.020%), Jamaican (78.9%, a difference of 0.030%), Immigrants from North America (79.0%, a difference of 0.040%), and Immigrants from Micronesia (78.9%, a difference of 0.040%).
| Demographics | Rating | Rank | In Labor Force | Age 20-64 |
| Japanese | 4.0 /100 | #233 | Tragic 79.1% |
| Immigrants | Canada | 3.2 /100 | #234 | Tragic 79.0% |
| Tlingit-Haida | 3.2 /100 | #235 | Tragic 79.0% |
| Samoans | 2.9 /100 | #236 | Tragic 79.0% |
| Immigrants | North America | 2.9 /100 | #237 | Tragic 79.0% |
| Immigrants | Jamaica | 2.6 /100 | #238 | Tragic 79.0% |
| Welsh | 2.4 /100 | #239 | Tragic 79.0% |
| Trinidadians and Tobagonians | 2.3 /100 | #240 | Tragic 79.0% |
| Jamaicans | 2.0 /100 | #241 | Tragic 78.9% |
| Immigrants | Micronesia | 1.9 /100 | #242 | Tragic 78.9% |
| Immigrants | West Indies | 1.7 /100 | #243 | Tragic 78.9% |
| French | 1.5 /100 | #244 | Tragic 78.9% |
| Scottish | 1.3 /100 | #245 | Tragic 78.9% |
| Immigrants | Trinidad and Tobago | 1.1 /100 | #246 | Tragic 78.8% |
| Immigrants | Germany | 1.0 /100 | #247 | Tragic 78.8% |