Immigrants from Serbia vs Immigrants from Scotland In Labor Force | Age 20-64
COMPARE
Immigrants from Serbia
Immigrants from Scotland
In Labor Force | Age 20-64
In Labor Force | Age 20-64 Comparison
Immigrants from Serbia
Immigrants from Scotland
80.8%
IN LABOR FORCE | AGE 20-64
100.0/ 100
METRIC RATING
26th/ 347
METRIC RANK
79.6%
IN LABOR FORCE | AGE 20-64
52.4/ 100
METRIC RATING
173rd/ 347
METRIC RANK
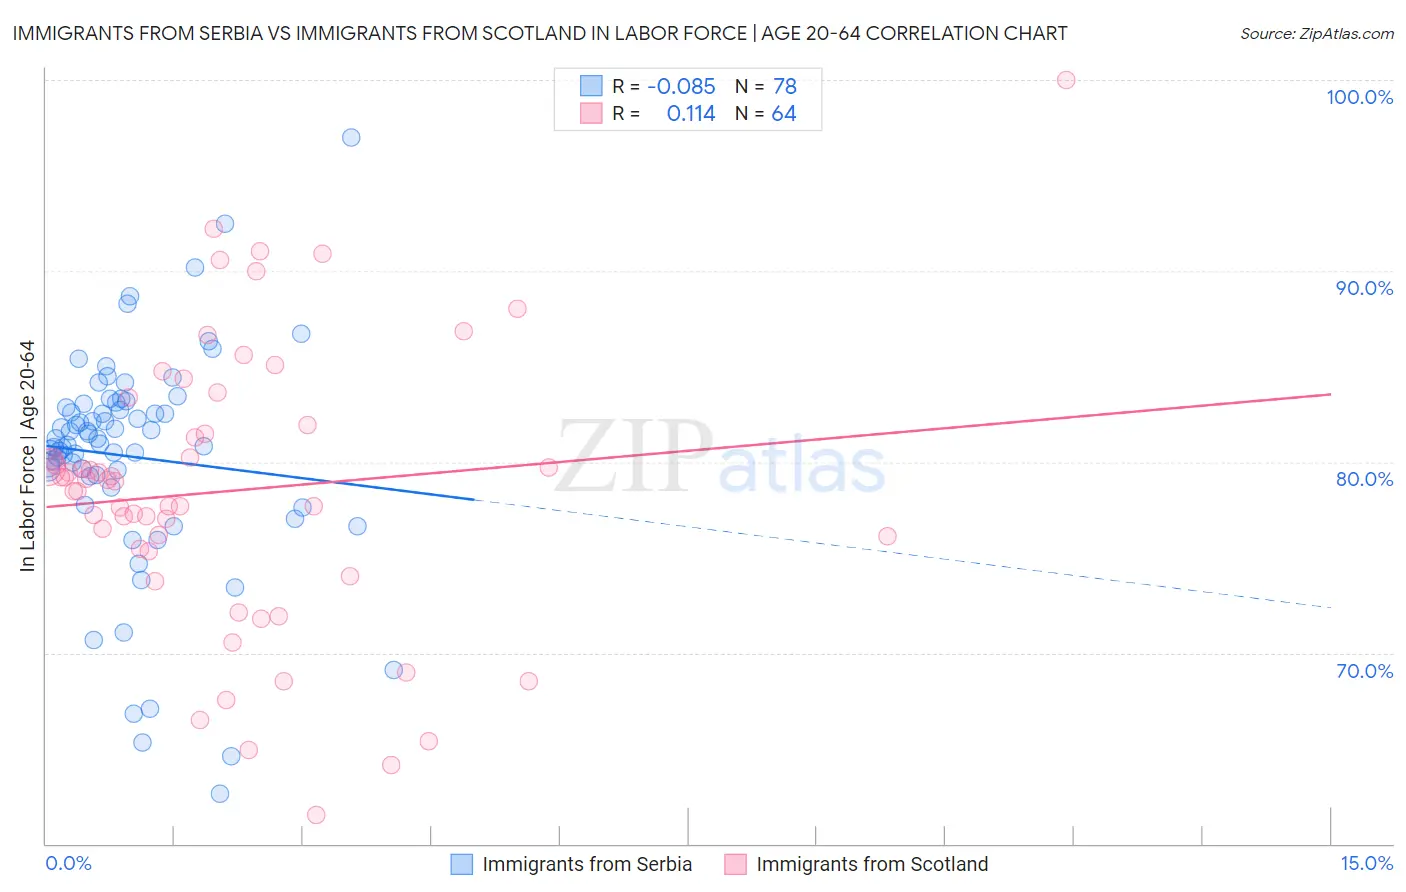
Immigrants from Serbia vs Immigrants from Scotland In Labor Force | Age 20-64 Correlation Chart
The statistical analysis conducted on geographies consisting of 131,747,619 people shows a slight negative correlation between the proportion of Immigrants from Serbia and labor force participation rate among population between the ages 20 and 64 in the United States with a correlation coefficient (R) of -0.085 and weighted average of 80.8%. Similarly, the statistical analysis conducted on geographies consisting of 196,399,264 people shows a poor positive correlation between the proportion of Immigrants from Scotland and labor force participation rate among population between the ages 20 and 64 in the United States with a correlation coefficient (R) of 0.114 and weighted average of 79.6%, a difference of 1.5%.
In Labor Force | Age 20-64 Correlation Summary
| Measurement | Immigrants from Serbia | Immigrants from Scotland |
| Minimum | 62.6% | 61.5% |
| Maximum | 97.0% | 100.0% |
| Range | 34.4% | 38.5% |
| Mean | 80.3% | 78.5% |
| Median | 81.1% | 79.0% |
| Interquartile 25% (IQ1) | 79.2% | 75.4% |
| Interquartile 75% (IQ3) | 83.1% | 81.7% |
| Interquartile Range (IQR) | 3.8% | 6.3% |
| Standard Deviation (Sample) | 5.9% | 7.4% |
| Standard Deviation (Population) | 5.8% | 7.3% |
Similar Demographics by In Labor Force | Age 20-64
Demographics Similar to Immigrants from Serbia by In Labor Force | Age 20-64
In terms of in labor force | age 20-64, the demographic groups most similar to Immigrants from Serbia are Kenyan (80.8%, a difference of 0.020%), Immigrants from Morocco (80.8%, a difference of 0.030%), Immigrants from Bosnia and Herzegovina (80.8%, a difference of 0.040%), Sudanese (80.8%, a difference of 0.050%), and Immigrants from Kenya (80.7%, a difference of 0.070%).
| Demographics | Rating | Rank | In Labor Force | Age 20-64 |
| Zimbabweans | 100.0 /100 | #19 | Exceptional 81.0% |
| Thais | 100.0 /100 | #20 | Exceptional 80.9% |
| Liberians | 100.0 /100 | #21 | Exceptional 80.9% |
| Sudanese | 100.0 /100 | #22 | Exceptional 80.8% |
| Immigrants | Bosnia and Herzegovina | 100.0 /100 | #23 | Exceptional 80.8% |
| Immigrants | Morocco | 100.0 /100 | #24 | Exceptional 80.8% |
| Kenyans | 100.0 /100 | #25 | Exceptional 80.8% |
| Immigrants | Serbia | 100.0 /100 | #26 | Exceptional 80.8% |
| Immigrants | Kenya | 99.9 /100 | #27 | Exceptional 80.7% |
| Immigrants | Uganda | 99.9 /100 | #28 | Exceptional 80.7% |
| Immigrants | South Central Asia | 99.9 /100 | #29 | Exceptional 80.7% |
| Immigrants | North Macedonia | 99.9 /100 | #30 | Exceptional 80.7% |
| Immigrants | Lithuania | 99.9 /100 | #31 | Exceptional 80.7% |
| Immigrants | Ireland | 99.9 /100 | #32 | Exceptional 80.7% |
| Chinese | 99.9 /100 | #33 | Exceptional 80.7% |
Demographics Similar to Immigrants from Scotland by In Labor Force | Age 20-64
In terms of in labor force | age 20-64, the demographic groups most similar to Immigrants from Scotland are Slavic (79.6%, a difference of 0.010%), Immigrants from Switzerland (79.6%, a difference of 0.010%), Immigrants from Belgium (79.6%, a difference of 0.010%), Syrian (79.6%, a difference of 0.020%), and Laotian (79.6%, a difference of 0.050%).
| Demographics | Rating | Rank | In Labor Force | Age 20-64 |
| Okinawans | 62.7 /100 | #166 | Good 79.6% |
| Immigrants | Iraq | 62.0 /100 | #167 | Good 79.6% |
| Immigrants | Indonesia | 61.8 /100 | #168 | Good 79.6% |
| Laotians | 58.4 /100 | #169 | Average 79.6% |
| Slavs | 54.0 /100 | #170 | Average 79.6% |
| Immigrants | Switzerland | 53.3 /100 | #171 | Average 79.6% |
| Immigrants | Belgium | 53.1 /100 | #172 | Average 79.6% |
| Immigrants | Scotland | 52.4 /100 | #173 | Average 79.6% |
| Syrians | 50.0 /100 | #174 | Average 79.6% |
| Cubans | 46.1 /100 | #175 | Average 79.5% |
| Australians | 46.0 /100 | #176 | Average 79.5% |
| Immigrants | Netherlands | 45.2 /100 | #177 | Average 79.5% |
| Czechoslovakians | 44.3 /100 | #178 | Average 79.5% |
| Armenians | 41.4 /100 | #179 | Average 79.5% |
| Salvadorans | 41.0 /100 | #180 | Average 79.5% |