Immigrants from Vietnam vs Choctaw Unemployment Among Ages 16 to 19 years
COMPARE
Immigrants from Vietnam
Choctaw
Unemployment Among Ages 16 to 19 years
Unemployment Among Ages 16 to 19 years Comparison
Immigrants from Vietnam
Choctaw
16.4%
UNEMPLOYMENT AMONG AGES 16 TO 19 YEARS
99.7/ 100
METRIC RATING
47th/ 347
METRIC RANK
19.0%
UNEMPLOYMENT AMONG AGES 16 TO 19 YEARS
0.1/ 100
METRIC RATING
265th/ 347
METRIC RANK
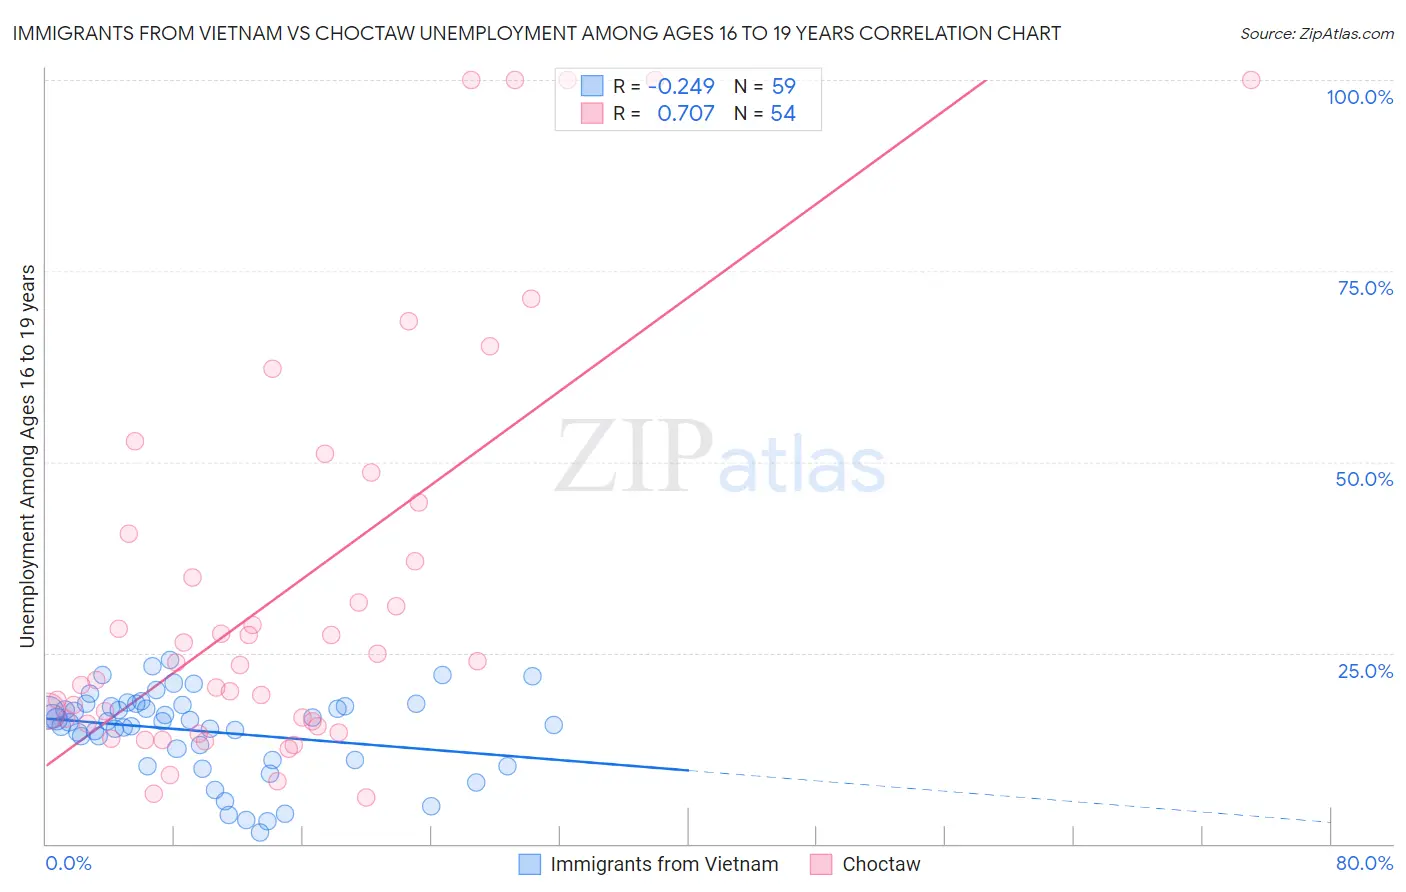
Immigrants from Vietnam vs Choctaw Unemployment Among Ages 16 to 19 years Correlation Chart
The statistical analysis conducted on geographies consisting of 385,853,252 people shows a weak negative correlation between the proportion of Immigrants from Vietnam and unemployment rate among population between the ages 16 and 19 in the United States with a correlation coefficient (R) of -0.249 and weighted average of 16.4%. Similarly, the statistical analysis conducted on geographies consisting of 258,990,484 people shows a strong positive correlation between the proportion of Choctaw and unemployment rate among population between the ages 16 and 19 in the United States with a correlation coefficient (R) of 0.707 and weighted average of 19.0%, a difference of 15.9%.
Unemployment Among Ages 16 to 19 years Correlation Summary
| Measurement | Immigrants from Vietnam | Choctaw |
| Minimum | 1.5% | 6.0% |
| Maximum | 24.1% | 100.0% |
| Range | 22.6% | 94.0% |
| Mean | 14.7% | 33.2% |
| Median | 16.0% | 23.6% |
| Interquartile 25% (IQ1) | 11.0% | 15.7% |
| Interquartile 75% (IQ3) | 18.1% | 40.6% |
| Interquartile Range (IQR) | 7.1% | 24.9% |
| Standard Deviation (Sample) | 5.5% | 26.6% |
| Standard Deviation (Population) | 5.4% | 26.4% |
Similar Demographics by Unemployment Among Ages 16 to 19 years
Demographics Similar to Immigrants from Vietnam by Unemployment Among Ages 16 to 19 years
In terms of unemployment among ages 16 to 19 years, the demographic groups most similar to Immigrants from Vietnam are Maltese (16.4%, a difference of 0.040%), Immigrants from North Macedonia (16.4%, a difference of 0.070%), Polish (16.4%, a difference of 0.090%), Immigrants from Zimbabwe (16.3%, a difference of 0.11%), and Iraqi (16.4%, a difference of 0.12%).
| Demographics | Rating | Rank | Unemployment Among Ages 16 to 19 years |
| Hmong | 99.8 /100 | #40 | Exceptional 16.3% |
| Immigrants | Nepal | 99.8 /100 | #41 | Exceptional 16.3% |
| Fijians | 99.8 /100 | #42 | Exceptional 16.3% |
| Immigrants | Lebanon | 99.8 /100 | #43 | Exceptional 16.3% |
| Immigrants | Zimbabwe | 99.7 /100 | #44 | Exceptional 16.3% |
| Poles | 99.7 /100 | #45 | Exceptional 16.4% |
| Immigrants | North Macedonia | 99.7 /100 | #46 | Exceptional 16.4% |
| Immigrants | Vietnam | 99.7 /100 | #47 | Exceptional 16.4% |
| Maltese | 99.7 /100 | #48 | Exceptional 16.4% |
| Iraqis | 99.7 /100 | #49 | Exceptional 16.4% |
| Bhutanese | 99.6 /100 | #50 | Exceptional 16.4% |
| Lebanese | 99.6 /100 | #51 | Exceptional 16.4% |
| Welsh | 99.6 /100 | #52 | Exceptional 16.4% |
| Slovenes | 99.6 /100 | #53 | Exceptional 16.4% |
| British | 99.5 /100 | #54 | Exceptional 16.5% |
Demographics Similar to Choctaw by Unemployment Among Ages 16 to 19 years
In terms of unemployment among ages 16 to 19 years, the demographic groups most similar to Choctaw are Yaqui (19.0%, a difference of 0.010%), Cree (19.0%, a difference of 0.040%), Immigrants from Honduras (19.0%, a difference of 0.090%), Salvadoran (18.9%, a difference of 0.17%), and Spanish American Indian (18.9%, a difference of 0.22%).
| Demographics | Rating | Rank | Unemployment Among Ages 16 to 19 years |
| Immigrants | Mexico | 0.2 /100 | #258 | Tragic 18.9% |
| Immigrants | Central America | 0.2 /100 | #259 | Tragic 18.9% |
| Nigerians | 0.2 /100 | #260 | Tragic 18.9% |
| Spanish American Indians | 0.1 /100 | #261 | Tragic 18.9% |
| Salvadorans | 0.1 /100 | #262 | Tragic 18.9% |
| Cree | 0.1 /100 | #263 | Tragic 19.0% |
| Yaqui | 0.1 /100 | #264 | Tragic 19.0% |
| Choctaw | 0.1 /100 | #265 | Tragic 19.0% |
| Immigrants | Honduras | 0.1 /100 | #266 | Tragic 19.0% |
| Israelis | 0.1 /100 | #267 | Tragic 19.0% |
| Immigrants | El Salvador | 0.1 /100 | #268 | Tragic 19.1% |
| Lumbee | 0.1 /100 | #269 | Tragic 19.1% |
| Hondurans | 0.1 /100 | #270 | Tragic 19.2% |
| Blackfeet | 0.0 /100 | #271 | Tragic 19.2% |
| Hispanics or Latinos | 0.0 /100 | #272 | Tragic 19.2% |