Immigrants from Venezuela vs Cuban In Labor Force | Age > 16

COMPARE

Immigrants from Venezuela
Race
Ancestry
AfghanAfricanAlaska NativeAlaskan AthabascanAlbanianAleutAlsatianAmericanApacheArabArapahoArgentineanArmenianAssyrian/Chaldean/SyriacAustralianAustrianBahamianBangladeshiBarbadianBasqueBelgianBelizeanBermudanBhutaneseBlackfeetBolivianBrazilianBritishBritish West IndianBulgarianBurmeseCajunCambodianCanadianCape VerdeanCarpatho RusynCelticCentral AmericanCentral American IndianCherokeeCheyenneChickasawChileanChineseChippewaChoctawColombianColvilleComancheCosta RicanCreeCreekCroatianCrowCypriotCzechCzechoslovakianDanishDelawareDominicanDutchDutch West IndianEastern EuropeanEcuadorianEgyptianEnglishEstonianEthiopianEuropeanFijianFilipinoFinnishFrenchFrench American IndianFrench CanadianGermanGerman RussianGhanaianGreekGuamanian/ChamorroGuatemalanGuyaneseHaitianHmongHonduranHopiHoumaHungarianIcelanderIndian (Asian)IndonesianInupiatIranianIraqiIrishIroquoisIsraeliItalianJamaicanJapaneseJordanianKenyanKiowaKoreanLaotianLatvianLebaneseLiberianLithuanianLumbeeLuxembourgerMacedonianMalaysianMalteseMarshalleseMenomineeMexicanMexican American IndianMongolianMoroccanNative HawaiianNavajoNepaleseNew ZealanderNicaraguanNigerianNorthern EuropeanNorwegianOkinawanOsageOttawaPaiutePakistaniPalestinianPanamanianParaguayanPennsylvania GermanPeruvianPimaPolishPortuguesePotawatomiPuebloPuerto RicanPuget Sound SalishRomanianRussianSalvadoranSamoanScandinavianScotch-IrishScottishSeminoleSenegaleseSerbianShoshoneSierra LeoneanSiouxSlavicSlovakSloveneSomaliSouth AfricanSouth AmericanSouth American IndianSoviet UnionSpaniardSpanishSpanish AmericanSpanish American IndianSri LankanSubsaharan AfricanSudaneseSwedishSwissSyrianTaiwaneseThaiTlingit-HaidaTohono O'OdhamTonganTrinidadian and TobagonianTsimshianTurkishU.S. Virgin IslanderUgandanUkrainianUruguayanUteVenezuelanVietnameseWelshWest IndianYakamaYaquiYugoslavianYumanYup'ikZimbabwean
Immigration
NonimmigrantsImmigrantsAfghanistanAfricaAlbaniaArgentinaArmeniaAsiaAustraliaAustriaBahamasBangladeshBarbadosBelarusBelgiumBelizeBoliviaBosnia and HerzegovinaBrazilBulgariaBurma/MyanmarCabo VerdeCambodiaCameroonCanadaCaribbeanCentral AmericaChileChinaColombiaCongoCosta RicaCroatiaCubaCzechoslovakiaDenmarkDominicaDominican RepublicEastern AfricaEastern AsiaEastern EuropeEcuadorEgyptEl SalvadorEnglandEritreaEthiopiaEuropeFijiFranceGermanyGhanaGreeceGrenadaGuatemalaGuyanaHaitiHondurasHong KongHungaryIndiaIndonesiaIranIraqIrelandIsraelItalyJamaicaJapanJordanKazakhstanKenyaKoreaKuwaitLaosLatin AmericaLatviaLebanonLiberiaLithuaniaMalaysiaMexicoMicronesiaMiddle AfricaMoldovaMoroccoNepalNetherlandsNicaraguaNigeriaNorth AmericaNorth MacedoniaNorthern AfricaNorthern EuropeNorwayOceaniaPakistanPanamaPeruPhilippinesPolandPortugalRomaniaRussiaSaudi ArabiaScotlandSenegalSerbiaSierra LeoneSingaporeSomaliaSouth AfricaSouth AmericaSouth Central AsiaSouth Eastern AsiaSouthern EuropeSpainSri LankaSt. Vincent and the GrenadinesSudanSwedenSwitzerlandSyriaTaiwanThailandTrinidad and TobagoTurkeyUgandaUkraineUruguayUzbekistanVenezuelaVietnamWest IndiesWestern AfricaWestern AsiaWestern EuropeYemenZaireZimbabweAzores
Cuban
Race
Ancestry
AfghanAfricanAlaska NativeAlaskan AthabascanAlbanianAleutAlsatianAmericanApacheArabArapahoArgentineanArmenianAssyrian/Chaldean/SyriacAustralianAustrianBahamianBangladeshiBarbadianBasqueBelgianBelizeanBermudanBhutaneseBlackfeetBolivianBrazilianBritishBritish West IndianBulgarianBurmeseCajunCambodianCanadianCape VerdeanCarpatho RusynCelticCentral AmericanCentral American IndianCherokeeCheyenneChickasawChileanChineseChippewaChoctawColombianColvilleComancheCosta RicanCreeCreekCroatianCrowCubanCypriotCzechCzechoslovakianDanishDelawareDominicanDutchDutch West IndianEastern EuropeanEcuadorianEgyptianEnglishEstonianEthiopianEuropeanFijianFilipinoFinnishFrenchFrench American IndianFrench CanadianGermanGerman RussianGhanaianGreekGuamanian/ChamorroGuatemalanGuyaneseHaitianHmongHonduranHopiHoumaHungarianIcelanderIndian (Asian)IndonesianInupiatIranianIraqiIrishIroquoisIsraeliItalianJamaicanJapaneseJordanianKenyanKiowaKoreanLaotianLatvianLebaneseLiberianLithuanianLumbeeLuxembourgerMacedonianMalaysianMalteseMarshalleseMenomineeMexicanMexican American IndianMongolianMoroccanNative HawaiianNavajoNepaleseNew ZealanderNicaraguanNigerianNorthern EuropeanNorwegianOkinawanOsageOttawaPaiutePakistaniPalestinianPanamanianParaguayanPennsylvania GermanPeruvianPimaPolishPortuguesePotawatomiPuebloPuerto RicanPuget Sound SalishRomanianRussianSalvadoranSamoanScandinavianScotch-IrishScottishSeminoleSenegaleseSerbianShoshoneSierra LeoneanSiouxSlavicSlovakSloveneSomaliSouth AfricanSouth AmericanSouth American IndianSoviet UnionSpaniardSpanishSpanish AmericanSpanish American IndianSri LankanSubsaharan AfricanSudaneseSwedishSwissSyrianTaiwaneseThaiTlingit-HaidaTohono O'OdhamTonganTrinidadian and TobagonianTsimshianTurkishU.S. Virgin IslanderUgandanUkrainianUruguayanUteVenezuelanVietnameseWelshWest IndianYakamaYaquiYugoslavianYumanYup'ikZimbabwean
Immigration
NonimmigrantsImmigrantsAfghanistanAfricaAlbaniaArgentinaArmeniaAsiaAustraliaAustriaBahamasBangladeshBarbadosBelarusBelgiumBelizeBoliviaBosnia and HerzegovinaBrazilBulgariaBurma/MyanmarCabo VerdeCambodiaCameroonCanadaCaribbeanCentral AmericaChileChinaColombiaCongoCosta RicaCroatiaCubaCzechoslovakiaDenmarkDominicaDominican RepublicEastern AfricaEastern AsiaEastern EuropeEcuadorEgyptEl SalvadorEnglandEritreaEthiopiaEuropeFijiFranceGermanyGhanaGreeceGrenadaGuatemalaGuyanaHaitiHondurasHong KongHungaryIndiaIndonesiaIranIraqIrelandIsraelItalyJamaicaJapanJordanKazakhstanKenyaKoreaKuwaitLaosLatin AmericaLatviaLebanonLiberiaLithuaniaMalaysiaMexicoMicronesiaMiddle AfricaMoldovaMoroccoNepalNetherlandsNicaraguaNigeriaNorth AmericaNorth MacedoniaNorthern AfricaNorthern EuropeNorwayOceaniaPakistanPanamaPeruPhilippinesPolandPortugalRomaniaRussiaSaudi ArabiaScotlandSenegalSerbiaSierra LeoneSingaporeSomaliaSouth AfricaSouth AmericaSouth Central AsiaSouth Eastern AsiaSouthern EuropeSpainSri LankaSt. Vincent and the GrenadinesSudanSwedenSwitzerlandSyriaTaiwanThailandTrinidad and TobagoTurkeyUgandaUkraineUruguayUzbekistanVietnamWest IndiesWestern AfricaWestern AsiaWestern EuropeYemenZaireZimbabweAzores
In Labor Force | Age > 16
Income
Poverty
Unemployment
Labor Participation
Family Structure
Vehicle Availability
Education Level
Disability

In Labor Force | Age > 16 Comparison

Immigrants from Venezuela

Cubans

Exceptional
Tragic
66.4%
IN LABOR FORCE | AGE > 16
99.9/ 100
METRIC RATING
55th/ 347
METRIC RANK
64.2%
IN LABOR FORCE | AGE > 16
0.5/ 100
METRIC RATING
265th/ 347
METRIC RANK

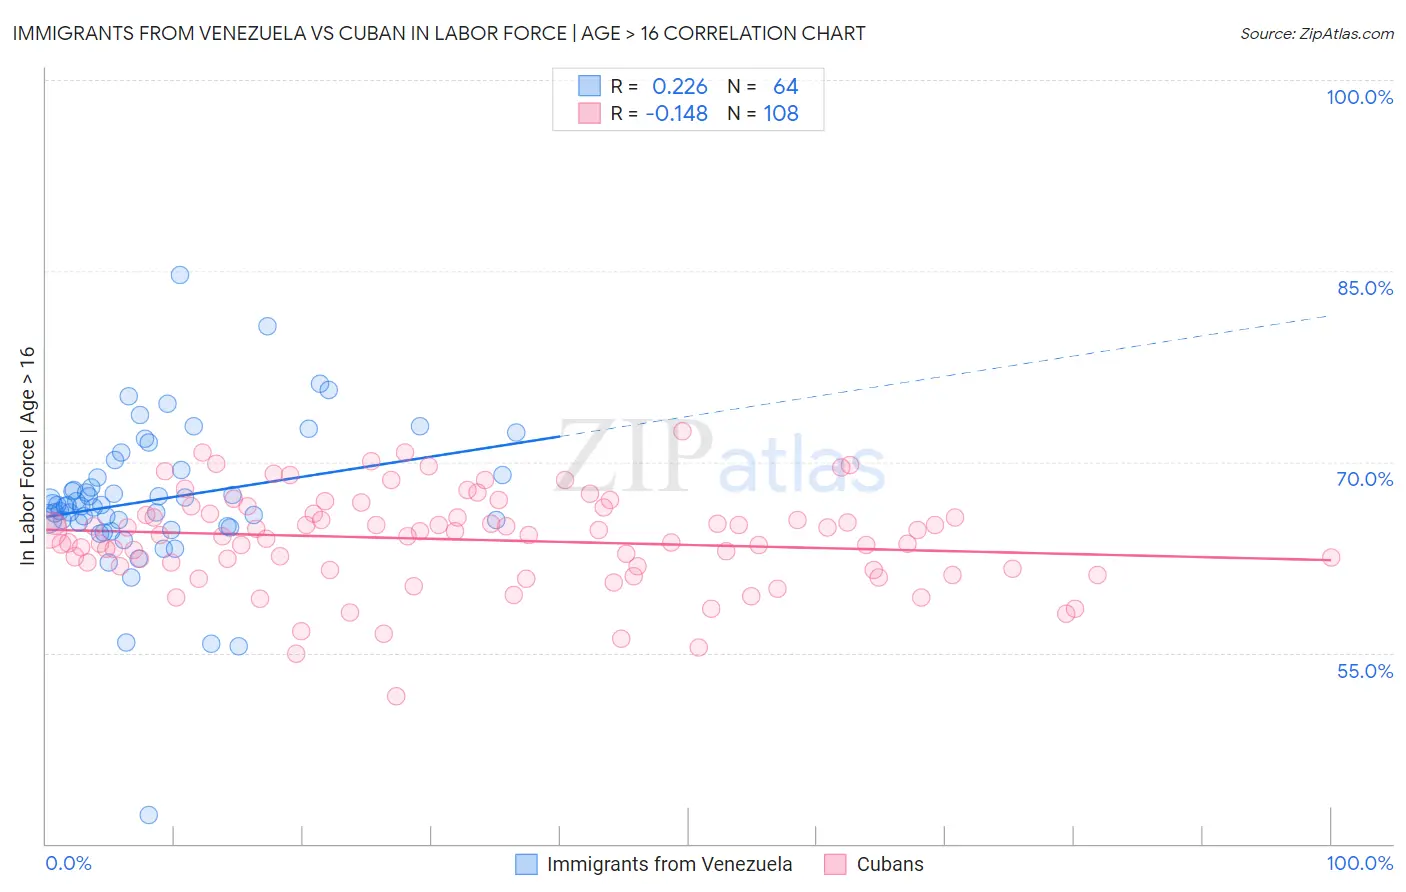
Immigrants from Venezuela vs Cuban In Labor Force | Age > 16 Correlation Chart

The statistical analysis conducted on geographies consisting of 287,871,143 people shows a weak positive correlation between the proportion of Immigrants from Venezuela and labor force participation rate among population ages 16 and over in the United States with a correlation coefficient (R) of 0.226 and weighted average of 66.4%. Similarly, the statistical analysis conducted on geographies consisting of 449,375,303 people shows a poor negative correlation between the proportion of Cubans and labor force participation rate among population ages 16 and over in the United States with a correlation coefficient (R) of -0.148 and weighted average of 64.2%, a difference of 3.5%.
Immigrants from Venezuela vs Cuban In Labor Force | Age > 16

In Labor Force | Age > 16 Correlation Summary

MeasurementImmigrants from VenezuelaCuban
Minimum42.3%51.6%
Maximum84.7%72.4%
Range42.4%20.8%
Mean67.1%63.9%
Median66.6%64.3%
Interquartile 25% (IQ1)65.1%61.7%
Interquartile 75% (IQ3)69.2%65.9%
Interquartile Range (IQR)4.1%4.2%
Standard Deviation (Sample)5.9%3.7%
Standard Deviation (Population)5.9%3.7%

Similar Demographics by In Labor Force | Age > 16

Demographics Similar to Immigrants from Venezuela by In Labor Force | Age > 16

In terms of in labor force | age > 16, the demographic groups most similar to Immigrants from Venezuela are Immigrants from Senegal (66.4%, a difference of 0.030%), Bulgarian (66.4%, a difference of 0.040%), Immigrants from Bosnia and Herzegovina (66.5%, a difference of 0.050%), Immigrants from Sri Lanka (66.5%, a difference of 0.080%), and Paraguayan (66.5%, a difference of 0.10%).
DemographicsRating | RankIn Labor Force | Age > 16
Nigerians
100.0
/100
|
#48
Exceptional
66.6%
Immigrants | Northern Africa
100.0
/100
|
#49
Exceptional
66.6%
Cape Verdeans
100.0
/100
|
#50
Exceptional
66.6%
Immigrants | Kuwait
100.0
/100
|
#51
Exceptional
66.5%
Paraguayans
99.9
/100
|
#52
Exceptional
66.5%
Immigrants | Sri Lanka
99.9
/100
|
#53
Exceptional
66.5%
Immigrants | Bosnia and Herzegovina
99.9
/100
|
#54
Exceptional
66.5%
Immigrants | Venezuela
99.9
/100
|
#55
Exceptional
66.4%
Immigrants | Senegal
99.9
/100
|
#56
Exceptional
66.4%
Bulgarians
99.9
/100
|
#57
Exceptional
66.4%
Immigrants | Saudi Arabia
99.9
/100
|
#58
Exceptional
66.3%
Immigrants | Turkey
99.9
/100
|
#59
Exceptional
66.3%
Immigrants | Peru
99.8
/100
|
#60
Exceptional
66.3%
Immigrants | Burma/Myanmar
99.8
/100
|
#61
Exceptional
66.3%
Indonesians
99.8
/100
|
#62
Exceptional
66.3%

Demographics Similar to Cubans by In Labor Force | Age > 16

In terms of in labor force | age > 16, the demographic groups most similar to Cubans are Immigrants from England (64.2%, a difference of 0.010%), Canadian (64.1%, a difference of 0.020%), Spaniard (64.1%, a difference of 0.020%), Dutch (64.2%, a difference of 0.040%), and Bahamian (64.2%, a difference of 0.060%).
DemographicsRating | RankIn Labor Force | Age > 16
Immigrants | Scotland
0.8
/100
|
#258
Tragic
64.2%
Immigrants | Western Europe
0.7
/100
|
#259
Tragic
64.2%
Marshallese
0.7
/100
|
#260
Tragic
64.2%
Basques
0.7
/100
|
#261
Tragic
64.2%
Finns
0.7
/100
|
#262
Tragic
64.2%
Bahamians
0.6
/100
|
#263
Tragic
64.2%
Dutch
0.6
/100
|
#264
Tragic
64.2%
Cubans
0.5
/100
|
#265
Tragic
64.2%
Immigrants | England
0.5
/100
|
#266
Tragic
64.2%
Canadians
0.5
/100
|
#267
Tragic
64.1%
Spaniards
0.5
/100
|
#268
Tragic
64.1%
Irish
0.4
/100
|
#269
Tragic
64.1%
Guyanese
0.4
/100
|
#270
Tragic
64.1%
Dominicans
0.4
/100
|
#271
Tragic
64.1%
Native Hawaiians
0.3
/100
|
#272
Tragic
64.1%