Immigrants from Ukraine vs Trinidadian and Tobagonian Median Earnings
COMPARE
Immigrants from Ukraine
Trinidadian and Tobagonian
Median Earnings
Median Earnings Comparison
Immigrants from Ukraine
Trinidadians and Tobagonians
$50,984
MEDIAN EARNINGS
99.8/ 100
METRIC RATING
71st/ 347
METRIC RANK
$45,820
MEDIAN EARNINGS
29.7/ 100
METRIC RATING
198th/ 347
METRIC RANK
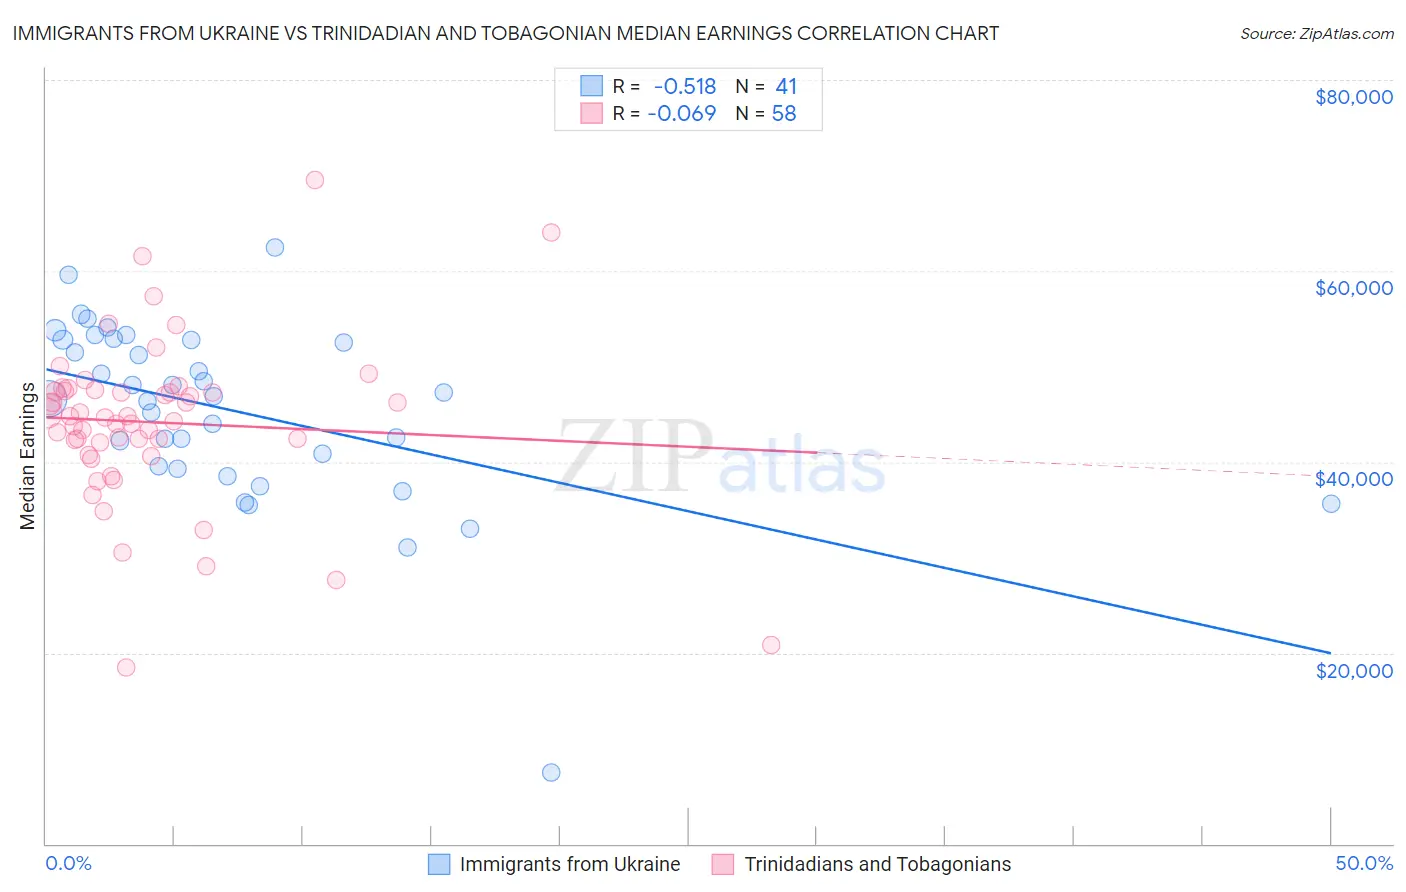
Immigrants from Ukraine vs Trinidadian and Tobagonian Median Earnings Correlation Chart
The statistical analysis conducted on geographies consisting of 289,705,710 people shows a substantial negative correlation between the proportion of Immigrants from Ukraine and median earnings in the United States with a correlation coefficient (R) of -0.518 and weighted average of $50,984. Similarly, the statistical analysis conducted on geographies consisting of 219,864,725 people shows a slight negative correlation between the proportion of Trinidadians and Tobagonians and median earnings in the United States with a correlation coefficient (R) of -0.069 and weighted average of $45,820, a difference of 11.3%.
Median Earnings Correlation Summary
| Measurement | Immigrants from Ukraine | Trinidadian and Tobagonian |
| Minimum | $7,500 | $18,432 |
| Maximum | $62,500 | $69,500 |
| Range | $55,000 | $51,068 |
| Mean | $45,386 | $44,150 |
| Median | $46,915 | $44,668 |
| Interquartile 25% (IQ1) | $39,380 | $42,022 |
| Interquartile 75% (IQ3) | $52,800 | $47,373 |
| Interquartile Range (IQR) | $13,420 | $5,351 |
| Standard Deviation (Sample) | $9,626 | $8,720 |
| Standard Deviation (Population) | $9,508 | $8,644 |
Similar Demographics by Median Earnings
Demographics Similar to Immigrants from Ukraine by Median Earnings
In terms of median earnings, the demographic groups most similar to Immigrants from Ukraine are Lithuanian ($50,991, a difference of 0.010%), Mongolian ($51,038, a difference of 0.10%), Paraguayan ($51,068, a difference of 0.16%), Immigrants from Egypt ($50,901, a difference of 0.16%), and Immigrants from Spain ($51,092, a difference of 0.21%).
| Demographics | Rating | Rank | Median Earnings |
| New Zealanders | 99.9 /100 | #64 | Exceptional $51,246 |
| Greeks | 99.9 /100 | #65 | Exceptional $51,164 |
| Afghans | 99.9 /100 | #66 | Exceptional $51,112 |
| Immigrants | Spain | 99.9 /100 | #67 | Exceptional $51,092 |
| Paraguayans | 99.9 /100 | #68 | Exceptional $51,068 |
| Mongolians | 99.8 /100 | #69 | Exceptional $51,038 |
| Lithuanians | 99.8 /100 | #70 | Exceptional $50,991 |
| Immigrants | Ukraine | 99.8 /100 | #71 | Exceptional $50,984 |
| Immigrants | Egypt | 99.8 /100 | #72 | Exceptional $50,901 |
| Immigrants | Netherlands | 99.8 /100 | #73 | Exceptional $50,818 |
| South Africans | 99.8 /100 | #74 | Exceptional $50,752 |
| Immigrants | Scotland | 99.8 /100 | #75 | Exceptional $50,741 |
| Immigrants | Italy | 99.7 /100 | #76 | Exceptional $50,581 |
| Immigrants | Western Europe | 99.7 /100 | #77 | Exceptional $50,549 |
| Argentineans | 99.6 /100 | #78 | Exceptional $50,399 |
Demographics Similar to Trinidadians and Tobagonians by Median Earnings
In terms of median earnings, the demographic groups most similar to Trinidadians and Tobagonians are Immigrants from Barbados ($45,816, a difference of 0.010%), Immigrants from the Azores ($45,812, a difference of 0.020%), Yugoslavian ($45,846, a difference of 0.060%), Barbadian ($45,846, a difference of 0.060%), and Immigrants from St. Vincent and the Grenadines ($45,908, a difference of 0.19%).
| Demographics | Rating | Rank | Median Earnings |
| Finns | 33.4 /100 | #191 | Fair $45,940 |
| Germans | 33.2 /100 | #192 | Fair $45,935 |
| Guamanians/Chamorros | 33.2 /100 | #193 | Fair $45,933 |
| Immigrants | Costa Rica | 33.0 /100 | #194 | Fair $45,928 |
| Immigrants | St. Vincent and the Grenadines | 32.4 /100 | #195 | Fair $45,908 |
| Yugoslavians | 30.5 /100 | #196 | Fair $45,846 |
| Barbadians | 30.5 /100 | #197 | Fair $45,846 |
| Trinidadians and Tobagonians | 29.7 /100 | #198 | Fair $45,820 |
| Immigrants | Barbados | 29.6 /100 | #199 | Fair $45,816 |
| Immigrants | Azores | 29.5 /100 | #200 | Fair $45,812 |
| Celtics | 27.2 /100 | #201 | Fair $45,732 |
| Immigrants | Trinidad and Tobago | 27.1 /100 | #202 | Fair $45,729 |
| Welsh | 26.6 /100 | #203 | Fair $45,710 |
| Immigrants | Uruguay | 25.9 /100 | #204 | Fair $45,682 |
| Tongans | 25.4 /100 | #205 | Fair $45,665 |