Immigrants from Ukraine vs German In Labor Force | Age 20-24
COMPARE
Immigrants from Ukraine
German
In Labor Force | Age 20-24
In Labor Force | Age 20-24 Comparison
Immigrants from Ukraine
Germans
74.2%
IN LABOR FORCE | AGE 20-24
5.1/ 100
METRIC RATING
228th/ 347
METRIC RANK
78.6%
IN LABOR FORCE | AGE 20-24
100.0/ 100
METRIC RATING
12th/ 347
METRIC RANK
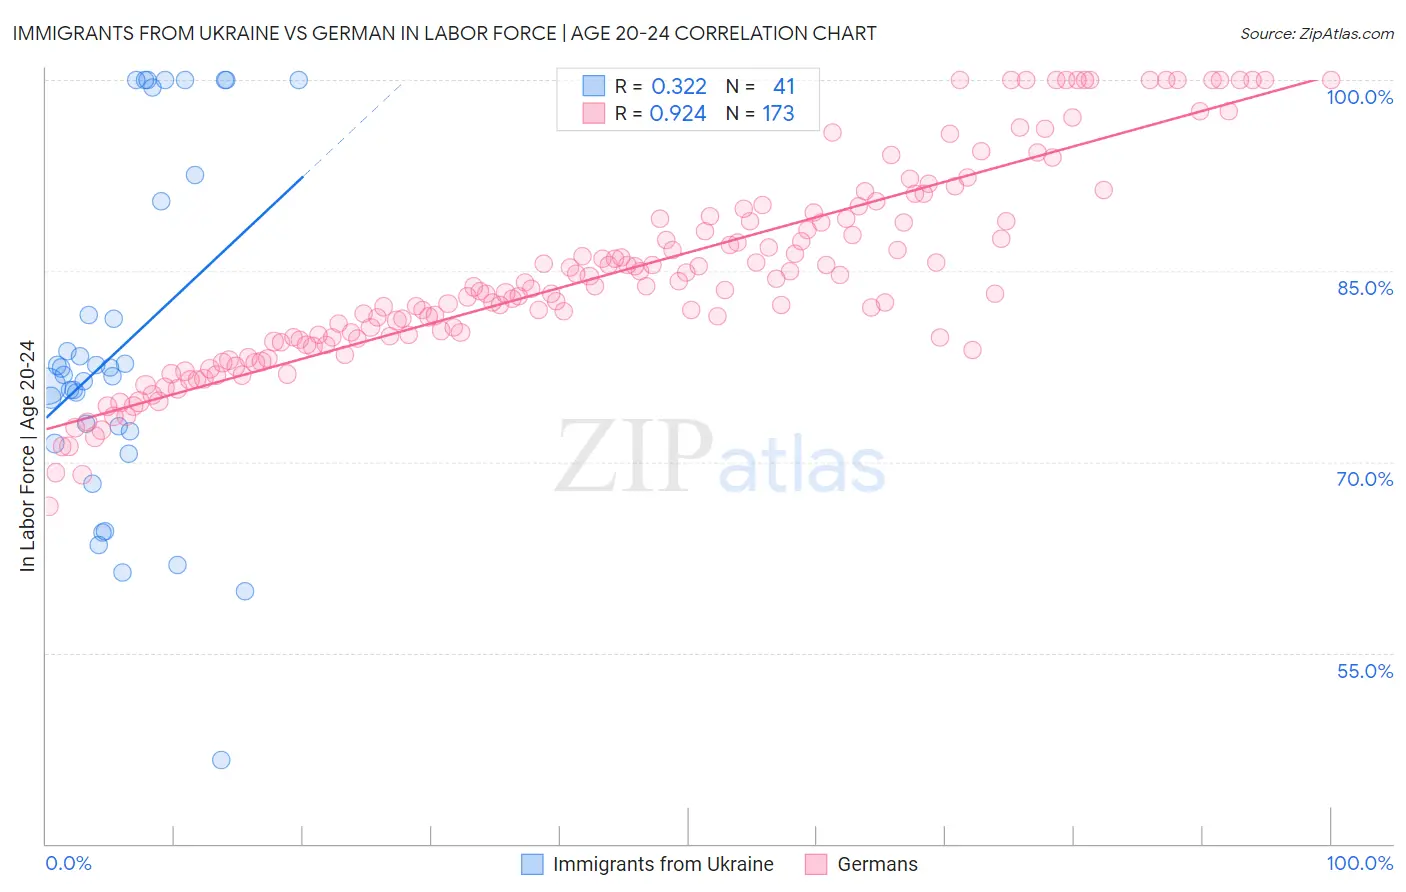
Immigrants from Ukraine vs German In Labor Force | Age 20-24 Correlation Chart
The statistical analysis conducted on geographies consisting of 289,649,876 people shows a mild positive correlation between the proportion of Immigrants from Ukraine and labor force participation rate among population between the ages 20 and 24 in the United States with a correlation coefficient (R) of 0.322 and weighted average of 74.2%. Similarly, the statistical analysis conducted on geographies consisting of 578,744,060 people shows a near-perfect positive correlation between the proportion of Germans and labor force participation rate among population between the ages 20 and 24 in the United States with a correlation coefficient (R) of 0.924 and weighted average of 78.6%, a difference of 5.8%.
In Labor Force | Age 20-24 Correlation Summary
| Measurement | Immigrants from Ukraine | German |
| Minimum | 46.6% | 66.5% |
| Maximum | 100.0% | 100.0% |
| Range | 53.4% | 33.5% |
| Mean | 79.2% | 84.7% |
| Median | 76.9% | 83.6% |
| Interquartile 25% (IQ1) | 71.9% | 79.5% |
| Interquartile 75% (IQ3) | 91.5% | 89.1% |
| Interquartile Range (IQR) | 19.6% | 9.6% |
| Standard Deviation (Sample) | 13.6% | 7.8% |
| Standard Deviation (Population) | 13.4% | 7.8% |
Similar Demographics by In Labor Force | Age 20-24
Demographics Similar to Immigrants from Ukraine by In Labor Force | Age 20-24
In terms of in labor force | age 20-24, the demographic groups most similar to Immigrants from Ukraine are Immigrants from Sweden (74.2%, a difference of 0.040%), Immigrants from Ireland (74.3%, a difference of 0.050%), Immigrants from Fiji (74.3%, a difference of 0.060%), Immigrants from Albania (74.2%, a difference of 0.060%), and Ghanaian (74.3%, a difference of 0.080%).
| Demographics | Rating | Rank | In Labor Force | Age 20-24 |
| Chickasaw | 10.3 /100 | #221 | Poor 74.5% |
| Immigrants | India | 9.9 /100 | #222 | Tragic 74.4% |
| Hispanics or Latinos | 7.9 /100 | #223 | Tragic 74.4% |
| Seminole | 6.9 /100 | #224 | Tragic 74.3% |
| Ghanaians | 6.2 /100 | #225 | Tragic 74.3% |
| Immigrants | Fiji | 5.9 /100 | #226 | Tragic 74.3% |
| Immigrants | Ireland | 5.8 /100 | #227 | Tragic 74.3% |
| Immigrants | Ukraine | 5.1 /100 | #228 | Tragic 74.2% |
| Immigrants | Sweden | 4.6 /100 | #229 | Tragic 74.2% |
| Immigrants | Albania | 4.3 /100 | #230 | Tragic 74.2% |
| Immigrants | Greece | 4.1 /100 | #231 | Tragic 74.2% |
| Immigrants | Switzerland | 4.1 /100 | #232 | Tragic 74.2% |
| Immigrants | Chile | 3.7 /100 | #233 | Tragic 74.1% |
| Immigrants | Immigrants | 3.6 /100 | #234 | Tragic 74.1% |
| Laotians | 3.5 /100 | #235 | Tragic 74.1% |
Demographics Similar to Germans by In Labor Force | Age 20-24
In terms of in labor force | age 20-24, the demographic groups most similar to Germans are Scandinavian (78.5%, a difference of 0.070%), Czech (78.5%, a difference of 0.070%), Finnish (78.7%, a difference of 0.11%), Slovene (78.7%, a difference of 0.15%), and Sudanese (78.4%, a difference of 0.21%).
| Demographics | Rating | Rank | In Labor Force | Age 20-24 |
| Aleuts | 100.0 /100 | #5 | Exceptional 79.0% |
| Danes | 100.0 /100 | #6 | Exceptional 79.0% |
| Luxembourgers | 100.0 /100 | #7 | Exceptional 79.0% |
| Immigrants | Cabo Verde | 100.0 /100 | #8 | Exceptional 78.9% |
| Swedes | 100.0 /100 | #9 | Exceptional 78.8% |
| Slovenes | 100.0 /100 | #10 | Exceptional 78.7% |
| Finns | 100.0 /100 | #11 | Exceptional 78.7% |
| Germans | 100.0 /100 | #12 | Exceptional 78.6% |
| Scandinavians | 100.0 /100 | #13 | Exceptional 78.5% |
| Czechs | 100.0 /100 | #14 | Exceptional 78.5% |
| Sudanese | 100.0 /100 | #15 | Exceptional 78.4% |
| Dutch | 100.0 /100 | #16 | Exceptional 78.4% |
| Cape Verdeans | 100.0 /100 | #17 | Exceptional 78.3% |
| Immigrants | Bosnia and Herzegovina | 100.0 /100 | #18 | Exceptional 78.1% |
| Bangladeshis | 100.0 /100 | #19 | Exceptional 78.1% |