Immigrants from Ukraine vs Polish In Labor Force | Age 20-24
COMPARE
Immigrants from Ukraine
Polish
In Labor Force | Age 20-24
In Labor Force | Age 20-24 Comparison
Immigrants from Ukraine
Poles
74.2%
IN LABOR FORCE | AGE 20-24
5.1/ 100
METRIC RATING
228th/ 347
METRIC RANK
77.6%
IN LABOR FORCE | AGE 20-24
100.0/ 100
METRIC RATING
31st/ 347
METRIC RANK
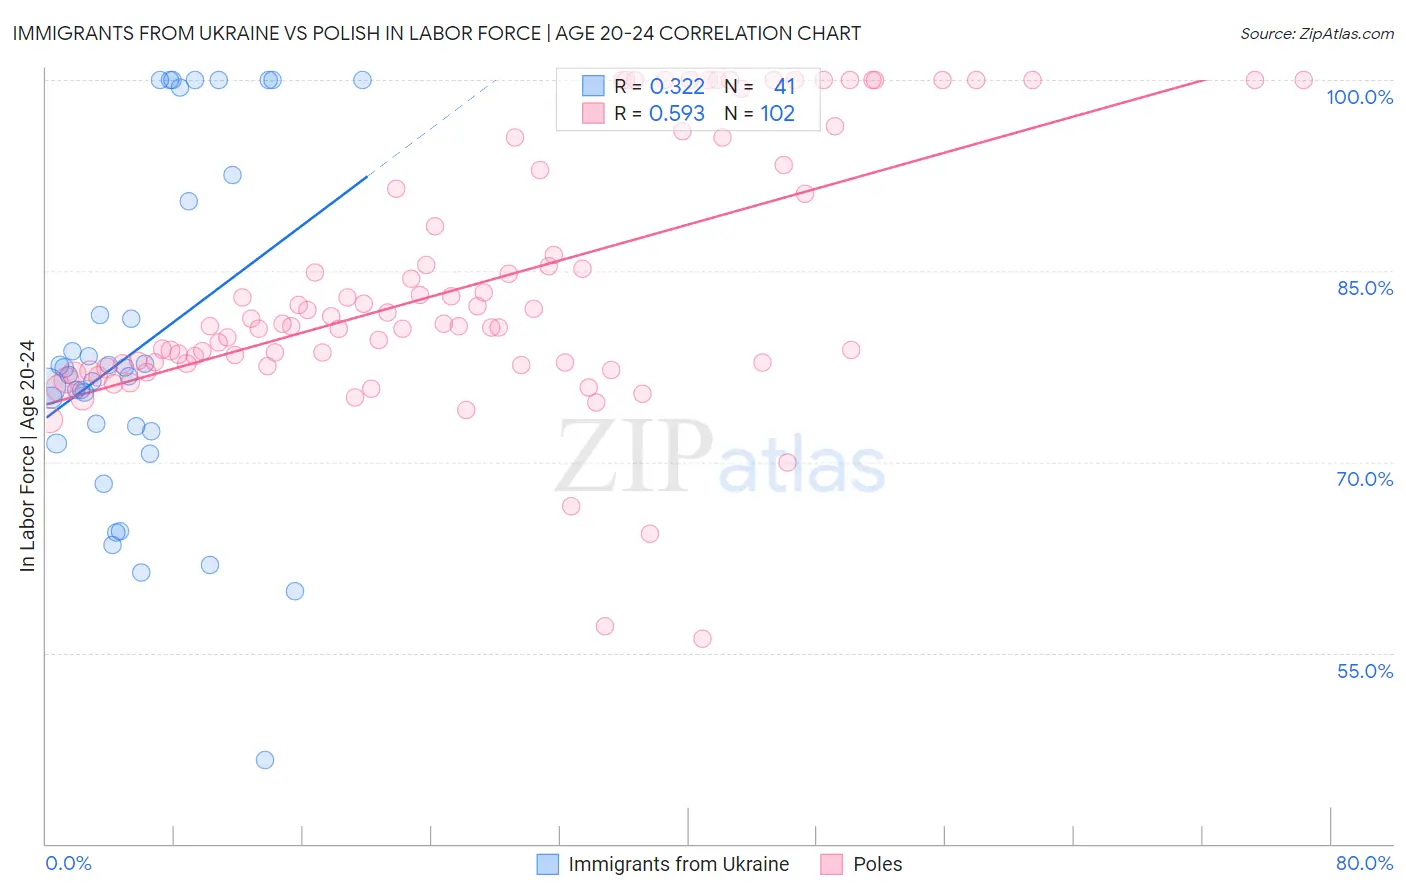
Immigrants from Ukraine vs Polish In Labor Force | Age 20-24 Correlation Chart
The statistical analysis conducted on geographies consisting of 289,649,876 people shows a mild positive correlation between the proportion of Immigrants from Ukraine and labor force participation rate among population between the ages 20 and 24 in the United States with a correlation coefficient (R) of 0.322 and weighted average of 74.2%. Similarly, the statistical analysis conducted on geographies consisting of 559,319,488 people shows a substantial positive correlation between the proportion of Poles and labor force participation rate among population between the ages 20 and 24 in the United States with a correlation coefficient (R) of 0.593 and weighted average of 77.6%, a difference of 4.5%.
In Labor Force | Age 20-24 Correlation Summary
| Measurement | Immigrants from Ukraine | Polish |
| Minimum | 46.6% | 56.1% |
| Maximum | 100.0% | 100.0% |
| Range | 53.4% | 43.9% |
| Mean | 79.2% | 83.9% |
| Median | 76.9% | 80.8% |
| Interquartile 25% (IQ1) | 71.9% | 77.7% |
| Interquartile 75% (IQ3) | 91.5% | 92.9% |
| Interquartile Range (IQR) | 19.6% | 15.2% |
| Standard Deviation (Sample) | 13.6% | 10.1% |
| Standard Deviation (Population) | 13.4% | 10.1% |
Similar Demographics by In Labor Force | Age 20-24
Demographics Similar to Immigrants from Ukraine by In Labor Force | Age 20-24
In terms of in labor force | age 20-24, the demographic groups most similar to Immigrants from Ukraine are Immigrants from Sweden (74.2%, a difference of 0.040%), Immigrants from Ireland (74.3%, a difference of 0.050%), Immigrants from Fiji (74.3%, a difference of 0.060%), Immigrants from Albania (74.2%, a difference of 0.060%), and Ghanaian (74.3%, a difference of 0.080%).
| Demographics | Rating | Rank | In Labor Force | Age 20-24 |
| Chickasaw | 10.3 /100 | #221 | Poor 74.5% |
| Immigrants | India | 9.9 /100 | #222 | Tragic 74.4% |
| Hispanics or Latinos | 7.9 /100 | #223 | Tragic 74.4% |
| Seminole | 6.9 /100 | #224 | Tragic 74.3% |
| Ghanaians | 6.2 /100 | #225 | Tragic 74.3% |
| Immigrants | Fiji | 5.9 /100 | #226 | Tragic 74.3% |
| Immigrants | Ireland | 5.8 /100 | #227 | Tragic 74.3% |
| Immigrants | Ukraine | 5.1 /100 | #228 | Tragic 74.2% |
| Immigrants | Sweden | 4.6 /100 | #229 | Tragic 74.2% |
| Immigrants | Albania | 4.3 /100 | #230 | Tragic 74.2% |
| Immigrants | Greece | 4.1 /100 | #231 | Tragic 74.2% |
| Immigrants | Switzerland | 4.1 /100 | #232 | Tragic 74.2% |
| Immigrants | Chile | 3.7 /100 | #233 | Tragic 74.1% |
| Immigrants | Immigrants | 3.6 /100 | #234 | Tragic 74.1% |
| Laotians | 3.5 /100 | #235 | Tragic 74.1% |
Demographics Similar to Poles by In Labor Force | Age 20-24
In terms of in labor force | age 20-24, the demographic groups most similar to Poles are English (77.6%, a difference of 0.060%), Immigrants from Ethiopia (77.5%, a difference of 0.11%), Swiss (77.7%, a difference of 0.12%), German Russian (77.5%, a difference of 0.12%), and Immigrants from Eastern Africa (77.5%, a difference of 0.13%).
| Demographics | Rating | Rank | In Labor Force | Age 20-24 |
| Liberians | 100.0 /100 | #24 | Exceptional 78.0% |
| Tlingit-Haida | 100.0 /100 | #25 | Exceptional 77.9% |
| Tongans | 100.0 /100 | #26 | Exceptional 77.9% |
| Immigrants | Micronesia | 100.0 /100 | #27 | Exceptional 77.8% |
| Belgians | 100.0 /100 | #28 | Exceptional 77.8% |
| Slovaks | 100.0 /100 | #29 | Exceptional 77.7% |
| Swiss | 100.0 /100 | #30 | Exceptional 77.7% |
| Poles | 100.0 /100 | #31 | Exceptional 77.6% |
| English | 100.0 /100 | #32 | Exceptional 77.6% |
| Immigrants | Ethiopia | 100.0 /100 | #33 | Exceptional 77.5% |
| German Russians | 100.0 /100 | #34 | Exceptional 77.5% |
| Immigrants | Eastern Africa | 100.0 /100 | #35 | Exceptional 77.5% |
| Welsh | 100.0 /100 | #36 | Exceptional 77.5% |
| Czechoslovakians | 100.0 /100 | #37 | Exceptional 77.5% |
| Marshallese | 100.0 /100 | #38 | Exceptional 77.4% |