Tohono O'odham vs Japanese In Labor Force | Age > 16
COMPARE
Tohono O'odham
Japanese
In Labor Force | Age > 16
In Labor Force | Age > 16 Comparison
Tohono O'odham
Japanese
57.2%
IN LABOR FORCE | AGE > 16
0.0/ 100
METRIC RATING
345th/ 347
METRIC RANK
65.8%
IN LABOR FORCE | AGE > 16
97.7/ 100
METRIC RATING
110th/ 347
METRIC RANK
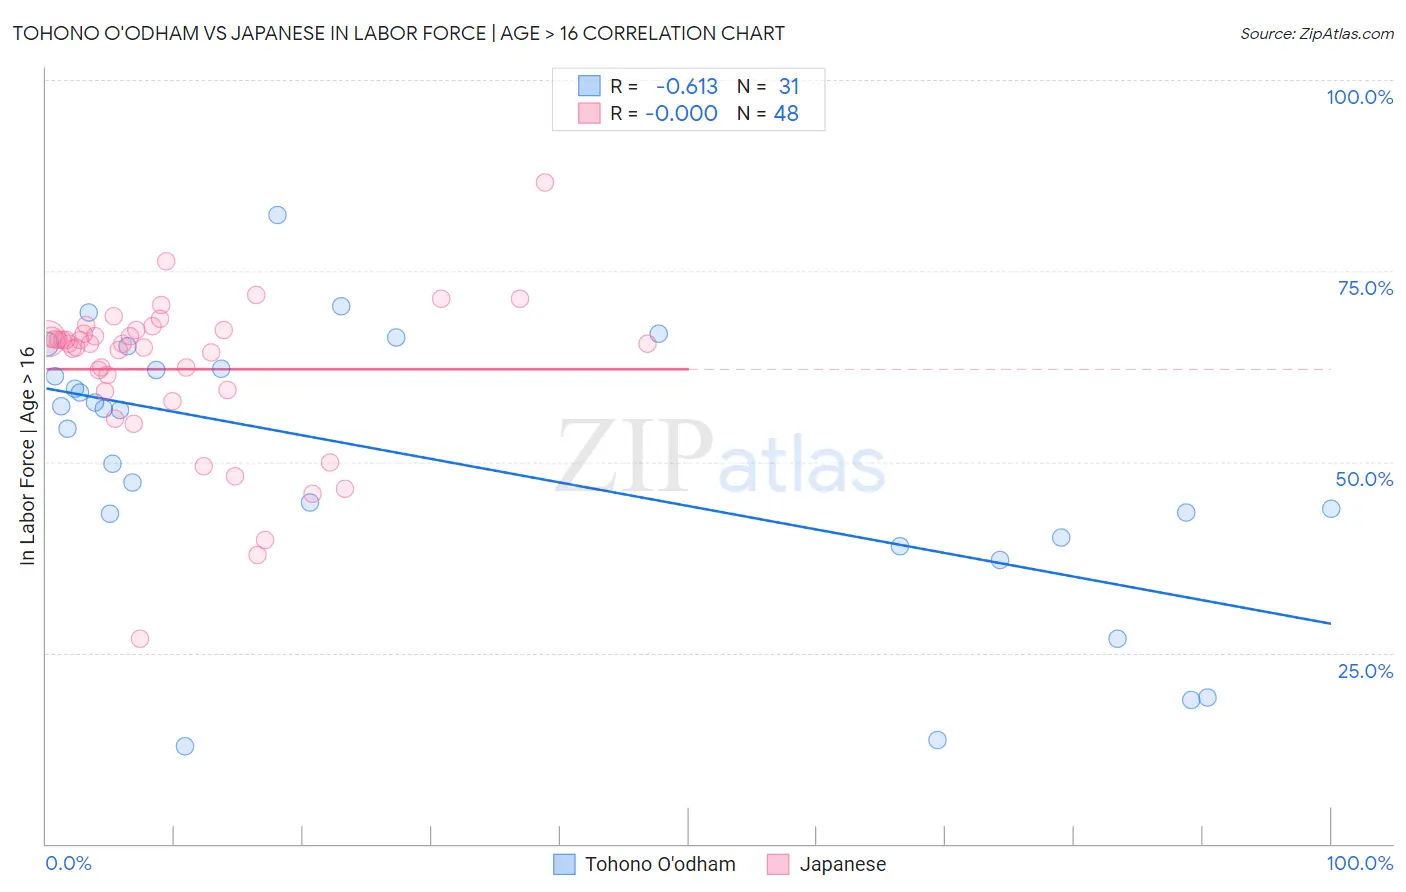
Tohono O'odham vs Japanese In Labor Force | Age > 16 Correlation Chart
The statistical analysis conducted on geographies consisting of 58,725,311 people shows a significant negative correlation between the proportion of Tohono O'odham and labor force participation rate among population ages 16 and over in the United States with a correlation coefficient (R) of -0.613 and weighted average of 57.2%. Similarly, the statistical analysis conducted on geographies consisting of 249,190,051 people shows no correlation between the proportion of Japanese and labor force participation rate among population ages 16 and over in the United States with a correlation coefficient (R) of -0.000 and weighted average of 65.8%, a difference of 15.0%.
In Labor Force | Age > 16 Correlation Summary
| Measurement | Tohono O'odham | Japanese |
| Minimum | 12.8% | 26.8% |
| Maximum | 82.3% | 86.5% |
| Range | 69.5% | 59.7% |
| Mean | 50.1% | 62.1% |
| Median | 56.8% | 65.4% |
| Interquartile 25% (IQ1) | 40.1% | 59.4% |
| Interquartile 75% (IQ3) | 62.2% | 67.0% |
| Interquartile Range (IQR) | 22.1% | 7.6% |
| Standard Deviation (Sample) | 17.7% | 10.4% |
| Standard Deviation (Population) | 17.4% | 10.3% |
Similar Demographics by In Labor Force | Age > 16
Demographics Similar to Tohono O'odham by In Labor Force | Age > 16
In terms of in labor force | age > 16, the demographic groups most similar to Tohono O'odham are Pima (57.4%, a difference of 0.29%), Lumbee (56.8%, a difference of 0.85%), Yuman (57.8%, a difference of 0.99%), Navajo (56.6%, a difference of 1.2%), and Puerto Rican (58.1%, a difference of 1.5%).
| Demographics | Rating | Rank | In Labor Force | Age > 16 |
| Paiute | 0.0 /100 | #333 | Tragic 60.7% |
| Apache | 0.0 /100 | #334 | Tragic 60.7% |
| Natives/Alaskans | 0.0 /100 | #335 | Tragic 60.6% |
| Menominee | 0.0 /100 | #336 | Tragic 60.6% |
| Colville | 0.0 /100 | #337 | Tragic 59.8% |
| Immigrants | Yemen | 0.0 /100 | #338 | Tragic 59.6% |
| Houma | 0.0 /100 | #339 | Tragic 59.5% |
| Pueblo | 0.0 /100 | #340 | Tragic 59.3% |
| Hopi | 0.0 /100 | #341 | Tragic 58.4% |
| Puerto Ricans | 0.0 /100 | #342 | Tragic 58.1% |
| Yuman | 0.0 /100 | #343 | Tragic 57.8% |
| Pima | 0.0 /100 | #344 | Tragic 57.4% |
| Tohono O'odham | 0.0 /100 | #345 | Tragic 57.2% |
| Lumbee | 0.0 /100 | #346 | Tragic 56.8% |
| Navajo | 0.0 /100 | #347 | Tragic 56.6% |
Demographics Similar to Japanese by In Labor Force | Age > 16
In terms of in labor force | age > 16, the demographic groups most similar to Japanese are Immigrants from Honduras (65.8%, a difference of 0.020%), Immigrants from Spain (65.8%, a difference of 0.040%), Immigrants from Japan (65.8%, a difference of 0.040%), Laotian (65.8%, a difference of 0.040%), and Immigrants from Poland (65.8%, a difference of 0.050%).
| Demographics | Rating | Rank | In Labor Force | Age > 16 |
| Immigrants | South Eastern Asia | 98.5 /100 | #103 | Exceptional 65.9% |
| Palestinians | 98.5 /100 | #104 | Exceptional 65.9% |
| Colombians | 98.4 /100 | #105 | Exceptional 65.9% |
| Immigrants | Serbia | 98.1 /100 | #106 | Exceptional 65.8% |
| Immigrants | Poland | 98.1 /100 | #107 | Exceptional 65.8% |
| Immigrants | Spain | 98.0 /100 | #108 | Exceptional 65.8% |
| Immigrants | Japan | 98.0 /100 | #109 | Exceptional 65.8% |
| Japanese | 97.7 /100 | #110 | Exceptional 65.8% |
| Immigrants | Honduras | 97.5 /100 | #111 | Exceptional 65.8% |
| Laotians | 97.4 /100 | #112 | Exceptional 65.8% |
| Pakistanis | 97.1 /100 | #113 | Exceptional 65.8% |
| Hondurans | 97.1 /100 | #114 | Exceptional 65.8% |
| Immigrants | Indonesia | 96.8 /100 | #115 | Exceptional 65.7% |
| Argentineans | 96.7 /100 | #116 | Exceptional 65.7% |
| Immigrants | Iran | 96.6 /100 | #117 | Exceptional 65.7% |