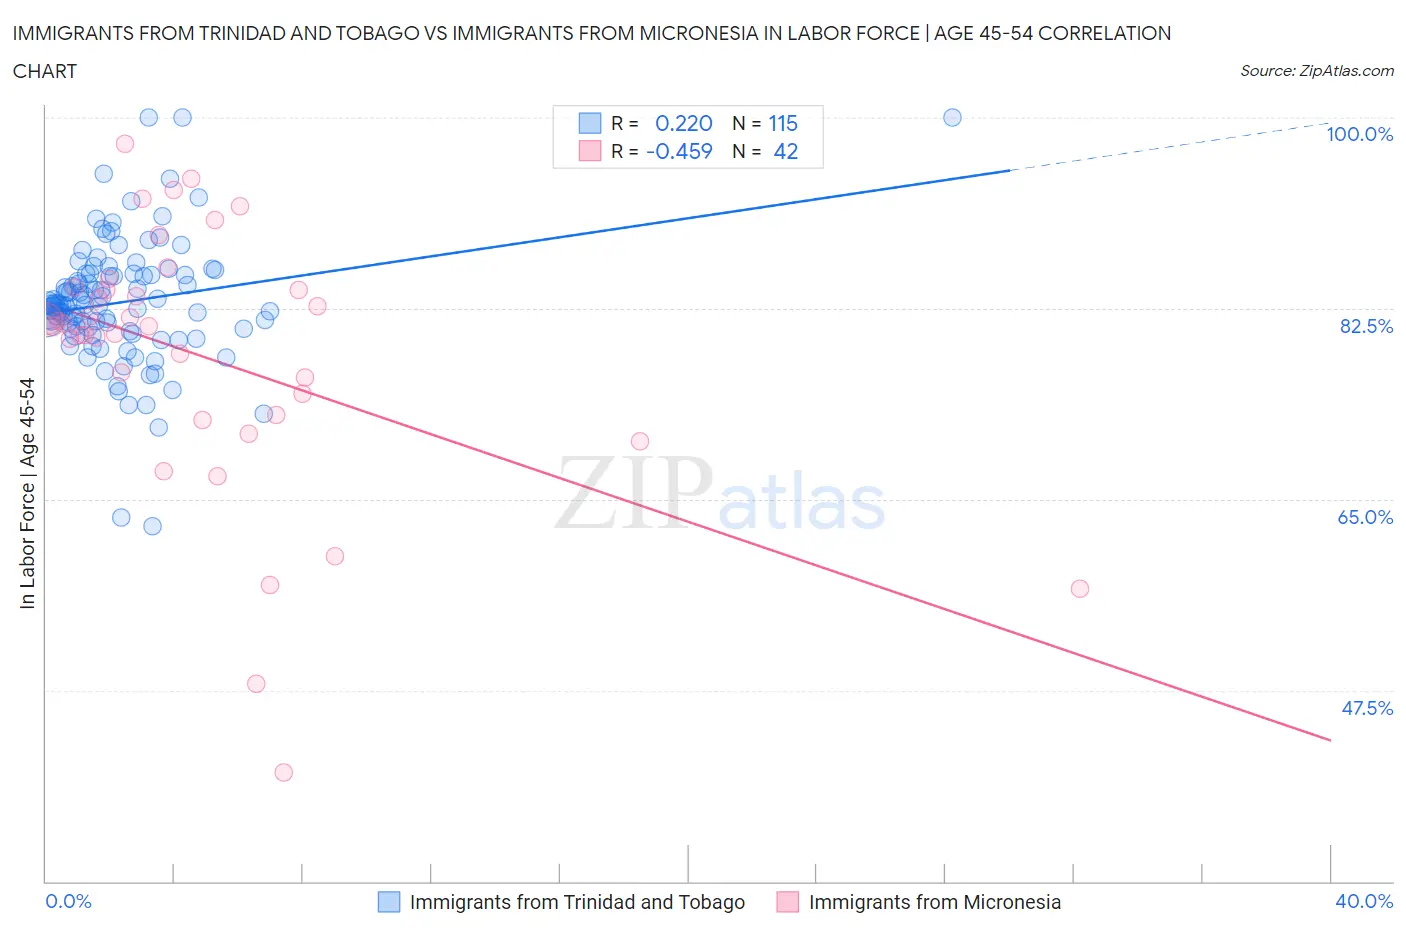
Immigrants from Trinidad and Tobago vs Immigrants from Micronesia In Labor Force | Age 45-54
COMPARE
Immigrants from Trinidad and Tobago
Immigrants from Micronesia
In Labor Force | Age 45-54
In Labor Force | Age 45-54 Comparison
Immigrants from Trinidad and Tobago
Immigrants from Micronesia
82.0%
IN LABOR FORCE | AGE 45-54
1.2/ 100
METRIC RATING
237th/ 347
METRIC RANK
81.1%
IN LABOR FORCE | AGE 45-54
0.0/ 100
METRIC RATING
279th/ 347
METRIC RANK
Immigrants from Trinidad and Tobago vs Immigrants from Micronesia In Labor Force | Age 45-54 Correlation Chart
The statistical analysis conducted on geographies consisting of 223,484,344 people shows a weak positive correlation between the proportion of Immigrants from Trinidad and Tobago and labor force participation rate among population between the ages 45 and 54 in the United States with a correlation coefficient (R) of 0.220 and weighted average of 82.0%. Similarly, the statistical analysis conducted on geographies consisting of 61,599,653 people shows a moderate negative correlation between the proportion of Immigrants from Micronesia and labor force participation rate among population between the ages 45 and 54 in the United States with a correlation coefficient (R) of -0.459 and weighted average of 81.1%, a difference of 1.0%.
In Labor Force | Age 45-54 Correlation Summary
| Measurement | Immigrants from Trinidad and Tobago | Immigrants from Micronesia |
| Minimum | 62.5% | 40.0% |
| Maximum | 100.0% | 97.6% |
| Range | 37.5% | 57.6% |
| Mean | 83.1% | 78.1% |
| Median | 82.8% | 80.8% |
| Interquartile 25% (IQ1) | 80.6% | 72.7% |
| Interquartile 75% (IQ3) | 85.6% | 84.2% |
| Interquartile Range (IQR) | 5.0% | 11.5% |
| Standard Deviation (Sample) | 5.8% | 12.1% |
| Standard Deviation (Population) | 5.8% | 11.9% |
Similar Demographics by In Labor Force | Age 45-54
Demographics Similar to Immigrants from Trinidad and Tobago by In Labor Force | Age 45-54
In terms of in labor force | age 45-54, the demographic groups most similar to Immigrants from Trinidad and Tobago are Subsaharan African (82.0%, a difference of 0.010%), Basque (82.0%, a difference of 0.010%), Trinidadian and Tobagonian (81.9%, a difference of 0.010%), Immigrants from Thailand (81.9%, a difference of 0.030%), and Immigrants from El Salvador (81.9%, a difference of 0.040%).
| Demographics | Rating | Rank | In Labor Force | Age 45-54 |
| Jamaicans | 1.8 /100 | #230 | Tragic 82.0% |
| Immigrants | Senegal | 1.7 /100 | #231 | Tragic 82.0% |
| Immigrants | Portugal | 1.7 /100 | #232 | Tragic 82.0% |
| Malaysians | 1.7 /100 | #233 | Tragic 82.0% |
| Salvadorans | 1.7 /100 | #234 | Tragic 82.0% |
| Sub-Saharan Africans | 1.2 /100 | #235 | Tragic 82.0% |
| Basques | 1.2 /100 | #236 | Tragic 82.0% |
| Immigrants | Trinidad and Tobago | 1.2 /100 | #237 | Tragic 82.0% |
| Trinidadians and Tobagonians | 1.1 /100 | #238 | Tragic 81.9% |
| Immigrants | Thailand | 1.0 /100 | #239 | Tragic 81.9% |
| Immigrants | El Salvador | 1.0 /100 | #240 | Tragic 81.9% |
| Immigrants | Cambodia | 0.8 /100 | #241 | Tragic 81.9% |
| Whites/Caucasians | 0.7 /100 | #242 | Tragic 81.9% |
| Samoans | 0.6 /100 | #243 | Tragic 81.8% |
| Celtics | 0.4 /100 | #244 | Tragic 81.8% |
Demographics Similar to Immigrants from Micronesia by In Labor Force | Age 45-54
In terms of in labor force | age 45-54, the demographic groups most similar to Immigrants from Micronesia are Immigrants from Guatemala (81.1%, a difference of 0.010%), Guatemalan (81.2%, a difference of 0.090%), U.S. Virgin Islander (81.2%, a difference of 0.11%), Immigrants from Latin America (81.0%, a difference of 0.11%), and Immigrants from Grenada (81.0%, a difference of 0.11%).
| Demographics | Rating | Rank | In Labor Force | Age 45-54 |
| Spanish | 0.0 /100 | #272 | Tragic 81.3% |
| Chippewa | 0.0 /100 | #273 | Tragic 81.3% |
| British West Indians | 0.0 /100 | #274 | Tragic 81.2% |
| Immigrants | Nonimmigrants | 0.0 /100 | #275 | Tragic 81.2% |
| U.S. Virgin Islanders | 0.0 /100 | #276 | Tragic 81.2% |
| Guatemalans | 0.0 /100 | #277 | Tragic 81.2% |
| Immigrants | Guatemala | 0.0 /100 | #278 | Tragic 81.1% |
| Immigrants | Micronesia | 0.0 /100 | #279 | Tragic 81.1% |
| Immigrants | Latin America | 0.0 /100 | #280 | Tragic 81.0% |
| Immigrants | Grenada | 0.0 /100 | #281 | Tragic 81.0% |
| Aleuts | 0.0 /100 | #282 | Tragic 81.0% |
| French American Indians | 0.0 /100 | #283 | Tragic 80.8% |
| Belizeans | 0.0 /100 | #284 | Tragic 80.8% |
| Delaware | 0.0 /100 | #285 | Tragic 80.8% |
| Immigrants | Dominica | 0.0 /100 | #286 | Tragic 80.8% |