Immigrants from Trinidad and Tobago vs Spaniard In Labor Force | Age 45-54
COMPARE
Immigrants from Trinidad and Tobago
Spaniard
In Labor Force | Age 45-54
In Labor Force | Age 45-54 Comparison
Immigrants from Trinidad and Tobago
Spaniards
82.0%
IN LABOR FORCE | AGE 45-54
1.2/ 100
METRIC RATING
237th/ 347
METRIC RANK
81.5%
IN LABOR FORCE | AGE 45-54
0.1/ 100
METRIC RATING
260th/ 347
METRIC RANK
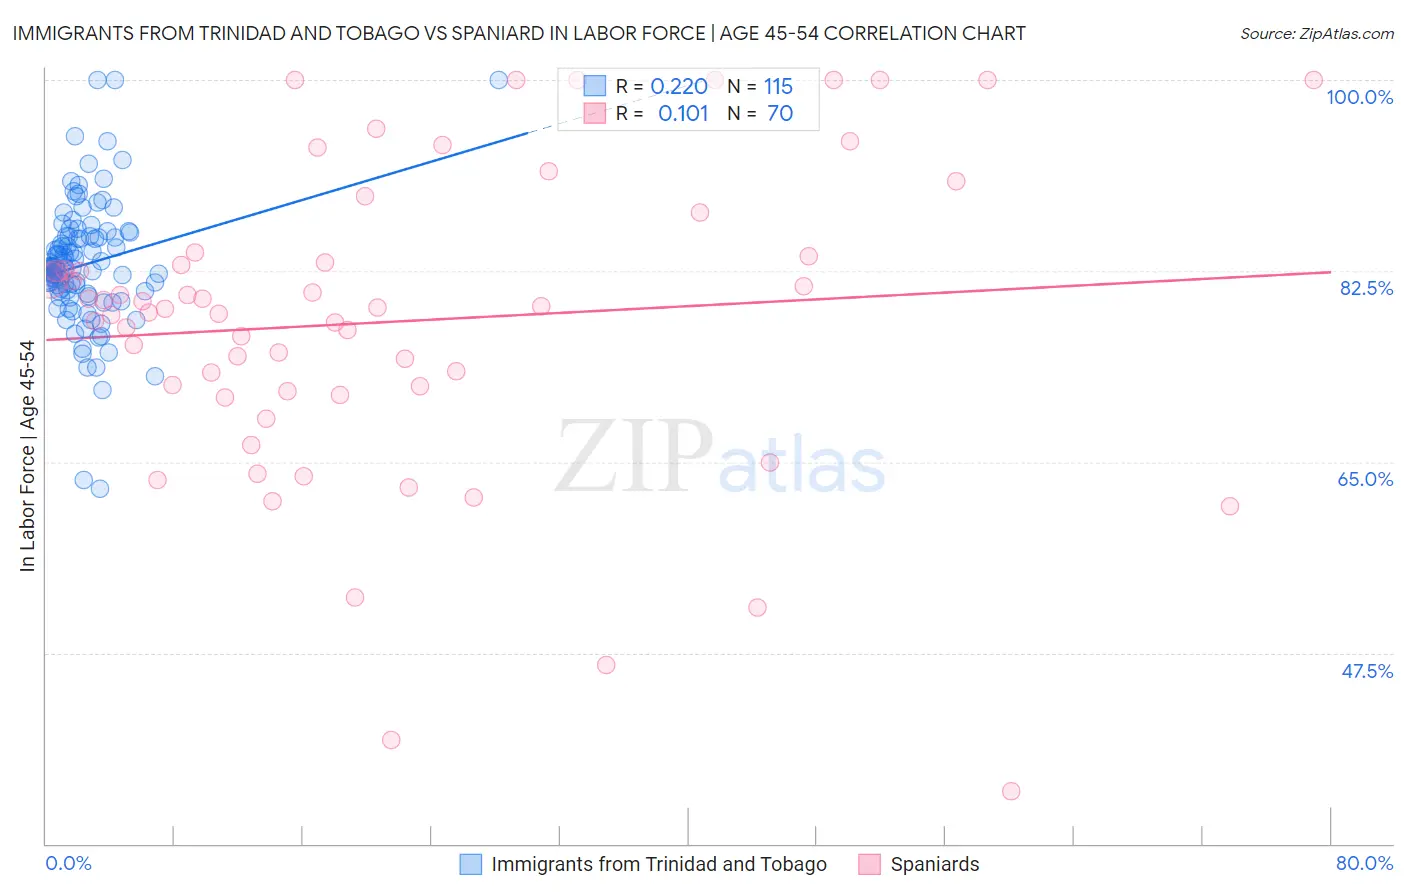
Immigrants from Trinidad and Tobago vs Spaniard In Labor Force | Age 45-54 Correlation Chart
The statistical analysis conducted on geographies consisting of 223,484,344 people shows a weak positive correlation between the proportion of Immigrants from Trinidad and Tobago and labor force participation rate among population between the ages 45 and 54 in the United States with a correlation coefficient (R) of 0.220 and weighted average of 82.0%. Similarly, the statistical analysis conducted on geographies consisting of 443,105,188 people shows a poor positive correlation between the proportion of Spaniards and labor force participation rate among population between the ages 45 and 54 in the United States with a correlation coefficient (R) of 0.101 and weighted average of 81.5%, a difference of 0.54%.
In Labor Force | Age 45-54 Correlation Summary
| Measurement | Immigrants from Trinidad and Tobago | Spaniard |
| Minimum | 62.5% | 34.8% |
| Maximum | 100.0% | 100.0% |
| Range | 37.5% | 65.2% |
| Mean | 83.1% | 77.9% |
| Median | 82.8% | 79.1% |
| Interquartile 25% (IQ1) | 80.6% | 71.5% |
| Interquartile 75% (IQ3) | 85.6% | 83.8% |
| Interquartile Range (IQR) | 5.0% | 12.3% |
| Standard Deviation (Sample) | 5.8% | 14.2% |
| Standard Deviation (Population) | 5.8% | 14.1% |
Similar Demographics by In Labor Force | Age 45-54
Demographics Similar to Immigrants from Trinidad and Tobago by In Labor Force | Age 45-54
In terms of in labor force | age 45-54, the demographic groups most similar to Immigrants from Trinidad and Tobago are Subsaharan African (82.0%, a difference of 0.010%), Basque (82.0%, a difference of 0.010%), Trinidadian and Tobagonian (81.9%, a difference of 0.010%), Immigrants from Thailand (81.9%, a difference of 0.030%), and Immigrants from El Salvador (81.9%, a difference of 0.040%).
| Demographics | Rating | Rank | In Labor Force | Age 45-54 |
| Jamaicans | 1.8 /100 | #230 | Tragic 82.0% |
| Immigrants | Senegal | 1.7 /100 | #231 | Tragic 82.0% |
| Immigrants | Portugal | 1.7 /100 | #232 | Tragic 82.0% |
| Malaysians | 1.7 /100 | #233 | Tragic 82.0% |
| Salvadorans | 1.7 /100 | #234 | Tragic 82.0% |
| Sub-Saharan Africans | 1.2 /100 | #235 | Tragic 82.0% |
| Basques | 1.2 /100 | #236 | Tragic 82.0% |
| Immigrants | Trinidad and Tobago | 1.2 /100 | #237 | Tragic 82.0% |
| Trinidadians and Tobagonians | 1.1 /100 | #238 | Tragic 81.9% |
| Immigrants | Thailand | 1.0 /100 | #239 | Tragic 81.9% |
| Immigrants | El Salvador | 1.0 /100 | #240 | Tragic 81.9% |
| Immigrants | Cambodia | 0.8 /100 | #241 | Tragic 81.9% |
| Whites/Caucasians | 0.7 /100 | #242 | Tragic 81.9% |
| Samoans | 0.6 /100 | #243 | Tragic 81.8% |
| Celtics | 0.4 /100 | #244 | Tragic 81.8% |
Demographics Similar to Spaniards by In Labor Force | Age 45-54
In terms of in labor force | age 45-54, the demographic groups most similar to Spaniards are Hawaiian (81.5%, a difference of 0.020%), Immigrants from Guyana (81.5%, a difference of 0.020%), Immigrants from Fiji (81.5%, a difference of 0.030%), Guyanese (81.5%, a difference of 0.030%), and Indonesian (81.5%, a difference of 0.030%).
| Demographics | Rating | Rank | In Labor Force | Age 45-54 |
| Japanese | 0.2 /100 | #253 | Tragic 81.6% |
| Immigrants | Laos | 0.2 /100 | #254 | Tragic 81.6% |
| Scotch-Irish | 0.2 /100 | #255 | Tragic 81.6% |
| Barbadians | 0.1 /100 | #256 | Tragic 81.6% |
| Immigrants | Congo | 0.1 /100 | #257 | Tragic 81.6% |
| Immigrants | Fiji | 0.1 /100 | #258 | Tragic 81.5% |
| Guyanese | 0.1 /100 | #259 | Tragic 81.5% |
| Spaniards | 0.1 /100 | #260 | Tragic 81.5% |
| Hawaiians | 0.1 /100 | #261 | Tragic 81.5% |
| Immigrants | Guyana | 0.1 /100 | #262 | Tragic 81.5% |
| Indonesians | 0.1 /100 | #263 | Tragic 81.5% |
| Immigrants | West Indies | 0.1 /100 | #264 | Tragic 81.5% |
| Hondurans | 0.1 /100 | #265 | Tragic 81.4% |
| Immigrants | St. Vincent and the Grenadines | 0.1 /100 | #266 | Tragic 81.4% |
| West Indians | 0.1 /100 | #267 | Tragic 81.4% |