Immigrants from Trinidad and Tobago vs Iraqi In Labor Force | Age 45-54
COMPARE
Immigrants from Trinidad and Tobago
Iraqi
In Labor Force | Age 45-54
In Labor Force | Age 45-54 Comparison
Immigrants from Trinidad and Tobago
Iraqis
82.0%
IN LABOR FORCE | AGE 45-54
1.2/ 100
METRIC RATING
237th/ 347
METRIC RANK
82.2%
IN LABOR FORCE | AGE 45-54
5.6/ 100
METRIC RATING
215th/ 347
METRIC RANK
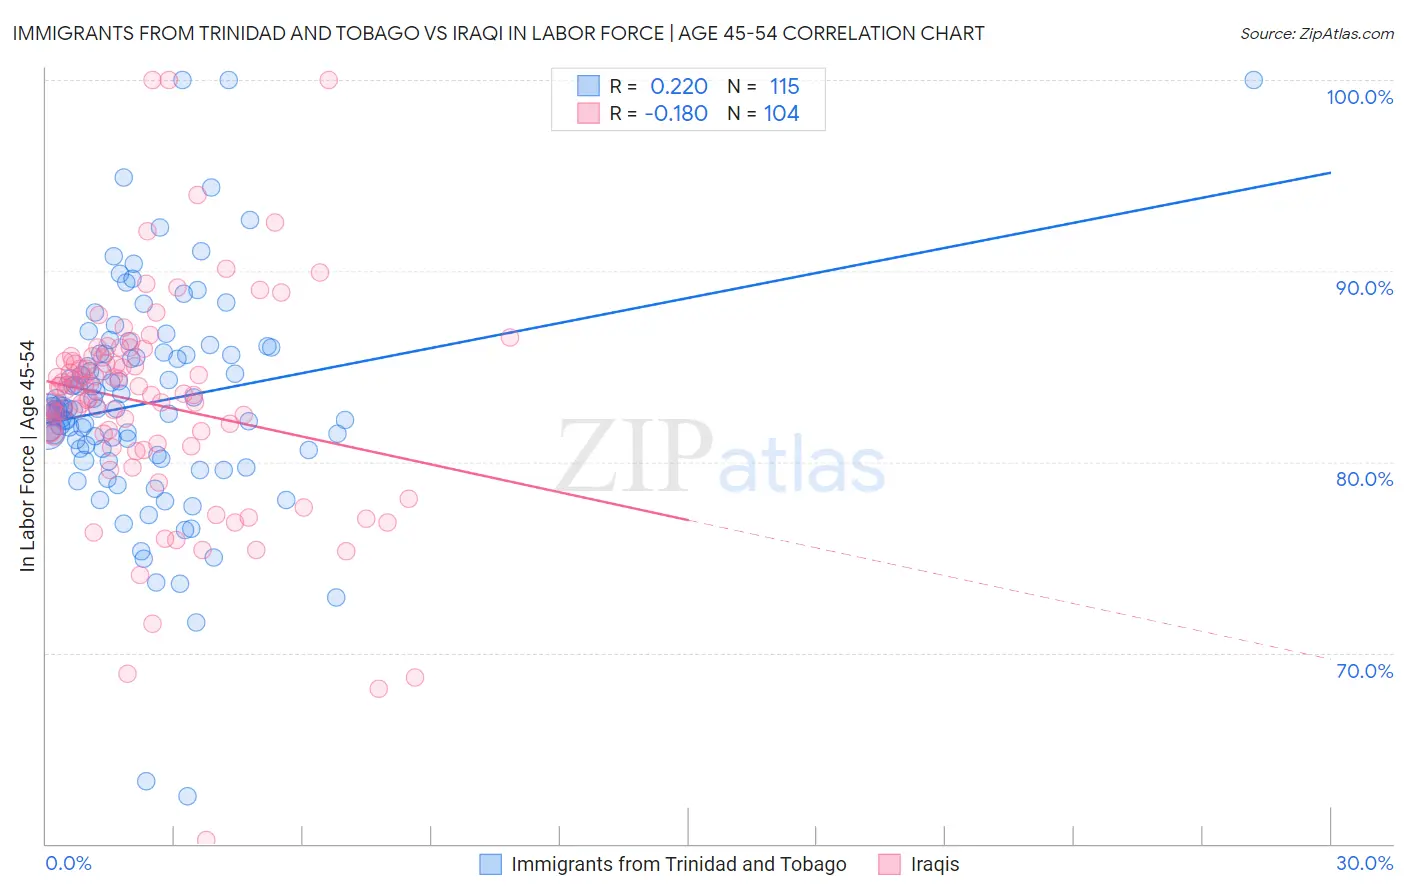
Immigrants from Trinidad and Tobago vs Iraqi In Labor Force | Age 45-54 Correlation Chart
The statistical analysis conducted on geographies consisting of 223,484,344 people shows a weak positive correlation between the proportion of Immigrants from Trinidad and Tobago and labor force participation rate among population between the ages 45 and 54 in the United States with a correlation coefficient (R) of 0.220 and weighted average of 82.0%. Similarly, the statistical analysis conducted on geographies consisting of 170,631,505 people shows a poor negative correlation between the proportion of Iraqis and labor force participation rate among population between the ages 45 and 54 in the United States with a correlation coefficient (R) of -0.180 and weighted average of 82.2%, a difference of 0.36%.
In Labor Force | Age 45-54 Correlation Summary
| Measurement | Immigrants from Trinidad and Tobago | Iraqi |
| Minimum | 62.5% | 60.2% |
| Maximum | 100.0% | 100.0% |
| Range | 37.5% | 39.8% |
| Mean | 83.1% | 83.0% |
| Median | 82.8% | 83.7% |
| Interquartile 25% (IQ1) | 80.6% | 80.9% |
| Interquartile 75% (IQ3) | 85.6% | 85.4% |
| Interquartile Range (IQR) | 5.0% | 4.5% |
| Standard Deviation (Sample) | 5.8% | 5.9% |
| Standard Deviation (Population) | 5.8% | 5.9% |
Similar Demographics by In Labor Force | Age 45-54
Demographics Similar to Immigrants from Trinidad and Tobago by In Labor Force | Age 45-54
In terms of in labor force | age 45-54, the demographic groups most similar to Immigrants from Trinidad and Tobago are Subsaharan African (82.0%, a difference of 0.010%), Basque (82.0%, a difference of 0.010%), Trinidadian and Tobagonian (81.9%, a difference of 0.010%), Immigrants from Thailand (81.9%, a difference of 0.030%), and Immigrants from El Salvador (81.9%, a difference of 0.040%).
| Demographics | Rating | Rank | In Labor Force | Age 45-54 |
| Jamaicans | 1.8 /100 | #230 | Tragic 82.0% |
| Immigrants | Senegal | 1.7 /100 | #231 | Tragic 82.0% |
| Immigrants | Portugal | 1.7 /100 | #232 | Tragic 82.0% |
| Malaysians | 1.7 /100 | #233 | Tragic 82.0% |
| Salvadorans | 1.7 /100 | #234 | Tragic 82.0% |
| Sub-Saharan Africans | 1.2 /100 | #235 | Tragic 82.0% |
| Basques | 1.2 /100 | #236 | Tragic 82.0% |
| Immigrants | Trinidad and Tobago | 1.2 /100 | #237 | Tragic 82.0% |
| Trinidadians and Tobagonians | 1.1 /100 | #238 | Tragic 81.9% |
| Immigrants | Thailand | 1.0 /100 | #239 | Tragic 81.9% |
| Immigrants | El Salvador | 1.0 /100 | #240 | Tragic 81.9% |
| Immigrants | Cambodia | 0.8 /100 | #241 | Tragic 81.9% |
| Whites/Caucasians | 0.7 /100 | #242 | Tragic 81.9% |
| Samoans | 0.6 /100 | #243 | Tragic 81.8% |
| Celtics | 0.4 /100 | #244 | Tragic 81.8% |
Demographics Similar to Iraqis by In Labor Force | Age 45-54
In terms of in labor force | age 45-54, the demographic groups most similar to Iraqis are Immigrants from Panama (82.2%, a difference of 0.0%), Immigrants from Uzbekistan (82.3%, a difference of 0.010%), Scottish (82.2%, a difference of 0.010%), Ecuadorian (82.3%, a difference of 0.030%), and Immigrants from Syria (82.3%, a difference of 0.040%).
| Demographics | Rating | Rank | In Labor Force | Age 45-54 |
| Native Hawaiians | 8.5 /100 | #208 | Tragic 82.3% |
| Immigrants | Lebanon | 7.4 /100 | #209 | Tragic 82.3% |
| Immigrants | Bahamas | 7.1 /100 | #210 | Tragic 82.3% |
| Immigrants | Syria | 6.6 /100 | #211 | Tragic 82.3% |
| Ecuadorians | 6.3 /100 | #212 | Tragic 82.3% |
| Immigrants | Uzbekistan | 5.8 /100 | #213 | Tragic 82.3% |
| Immigrants | Panama | 5.6 /100 | #214 | Tragic 82.2% |
| Iraqis | 5.6 /100 | #215 | Tragic 82.2% |
| Scottish | 5.3 /100 | #216 | Tragic 82.2% |
| Portuguese | 4.7 /100 | #217 | Tragic 82.2% |
| English | 4.4 /100 | #218 | Tragic 82.2% |
| French | 4.1 /100 | #219 | Tragic 82.2% |
| Bahamians | 3.6 /100 | #220 | Tragic 82.2% |
| Panamanians | 3.5 /100 | #221 | Tragic 82.2% |
| Immigrants | Ecuador | 3.4 /100 | #222 | Tragic 82.2% |