Immigrants from Thailand vs Immigrants from West Indies In Labor Force | Age > 16
COMPARE
Immigrants from Thailand
Immigrants from West Indies
In Labor Force | Age > 16
In Labor Force | Age > 16 Comparison
Immigrants from Thailand
Immigrants from West Indies
65.7%
IN LABOR FORCE | AGE > 16
96.6/ 100
METRIC RATING
118th/ 347
METRIC RANK
65.6%
IN LABOR FORCE | AGE > 16
92.0/ 100
METRIC RATING
138th/ 347
METRIC RANK
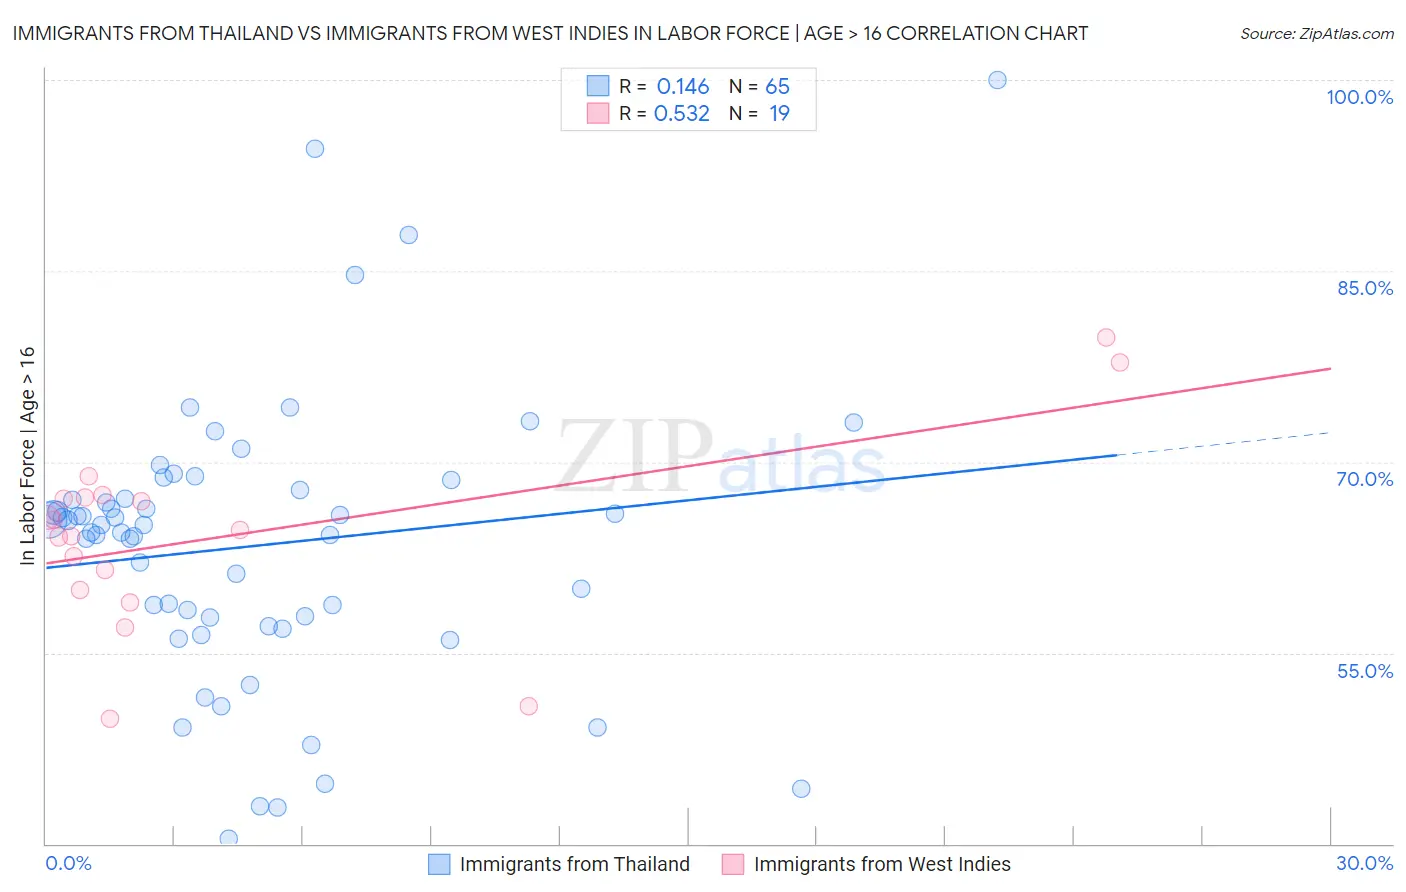
Immigrants from Thailand vs Immigrants from West Indies In Labor Force | Age > 16 Correlation Chart
The statistical analysis conducted on geographies consisting of 317,023,360 people shows a poor positive correlation between the proportion of Immigrants from Thailand and labor force participation rate among population ages 16 and over in the United States with a correlation coefficient (R) of 0.146 and weighted average of 65.7%. Similarly, the statistical analysis conducted on geographies consisting of 72,456,461 people shows a substantial positive correlation between the proportion of Immigrants from West Indies and labor force participation rate among population ages 16 and over in the United States with a correlation coefficient (R) of 0.532 and weighted average of 65.6%, a difference of 0.25%.
In Labor Force | Age > 16 Correlation Summary
| Measurement | Immigrants from Thailand | Immigrants from West Indies |
| Minimum | 40.4% | 49.8% |
| Maximum | 100.0% | 79.8% |
| Range | 59.6% | 30.0% |
| Mean | 63.4% | 64.2% |
| Median | 65.1% | 64.6% |
| Interquartile 25% (IQ1) | 57.4% | 60.0% |
| Interquartile 75% (IQ3) | 67.5% | 67.2% |
| Interquartile Range (IQR) | 10.1% | 7.2% |
| Standard Deviation (Sample) | 11.0% | 7.4% |
| Standard Deviation (Population) | 11.0% | 7.2% |
Demographics Similar to Immigrants from Thailand and Immigrants from West Indies by In Labor Force | Age > 16
In terms of in labor force | age > 16, the demographic groups most similar to Immigrants from Thailand are Immigrants from France (65.7%, a difference of 0.010%), Immigrants from Hong Kong (65.7%, a difference of 0.030%), New Zealander (65.7%, a difference of 0.050%), Immigrants from Ecuador (65.7%, a difference of 0.060%), and Immigrants from Iraq (65.7%, a difference of 0.080%). Similarly, the demographic groups most similar to Immigrants from West Indies are Guamanian/Chamorro (65.6%, a difference of 0.010%), Guatemalan (65.6%, a difference of 0.020%), Immigrants from Argentina (65.6%, a difference of 0.020%), Costa Rican (65.6%, a difference of 0.050%), and Immigrants from Lithuania (65.6%, a difference of 0.060%).
| Demographics | Rating | Rank | In Labor Force | Age > 16 |
| Immigrants | Thailand | 96.6 /100 | #118 | Exceptional 65.7% |
| Immigrants | France | 96.4 /100 | #119 | Exceptional 65.7% |
| Immigrants | Hong Kong | 96.2 /100 | #120 | Exceptional 65.7% |
| New Zealanders | 96.0 /100 | #121 | Exceptional 65.7% |
| Immigrants | Ecuador | 95.9 /100 | #122 | Exceptional 65.7% |
| Immigrants | Iraq | 95.5 /100 | #123 | Exceptional 65.7% |
| Iraqis | 95.4 /100 | #124 | Exceptional 65.7% |
| Norwegians | 95.3 /100 | #125 | Exceptional 65.7% |
| Koreans | 95.3 /100 | #126 | Exceptional 65.7% |
| Immigrants | Eastern Asia | 94.9 /100 | #127 | Exceptional 65.7% |
| Ecuadorians | 94.7 /100 | #128 | Exceptional 65.6% |
| Immigrants | Philippines | 94.5 /100 | #129 | Exceptional 65.6% |
| Immigrants | Guatemala | 94.4 /100 | #130 | Exceptional 65.6% |
| Icelanders | 94.3 /100 | #131 | Exceptional 65.6% |
| Immigrants | North Macedonia | 94.1 /100 | #132 | Exceptional 65.6% |
| Immigrants | Lithuania | 93.5 /100 | #133 | Exceptional 65.6% |
| Costa Ricans | 93.2 /100 | #134 | Exceptional 65.6% |
| Guatemalans | 92.5 /100 | #135 | Exceptional 65.6% |
| Immigrants | Argentina | 92.4 /100 | #136 | Exceptional 65.6% |
| Guamanians/Chamorros | 92.4 /100 | #137 | Exceptional 65.6% |
| Immigrants | West Indies | 92.0 /100 | #138 | Exceptional 65.6% |