Maltese vs Immigrants from West Indies In Labor Force | Age > 16
COMPARE
Maltese
Immigrants from West Indies
In Labor Force | Age > 16
In Labor Force | Age > 16 Comparison
Maltese
Immigrants from West Indies
64.8%
IN LABOR FORCE | AGE > 16
13.8/ 100
METRIC RATING
213th/ 347
METRIC RANK
65.6%
IN LABOR FORCE | AGE > 16
92.0/ 100
METRIC RATING
138th/ 347
METRIC RANK
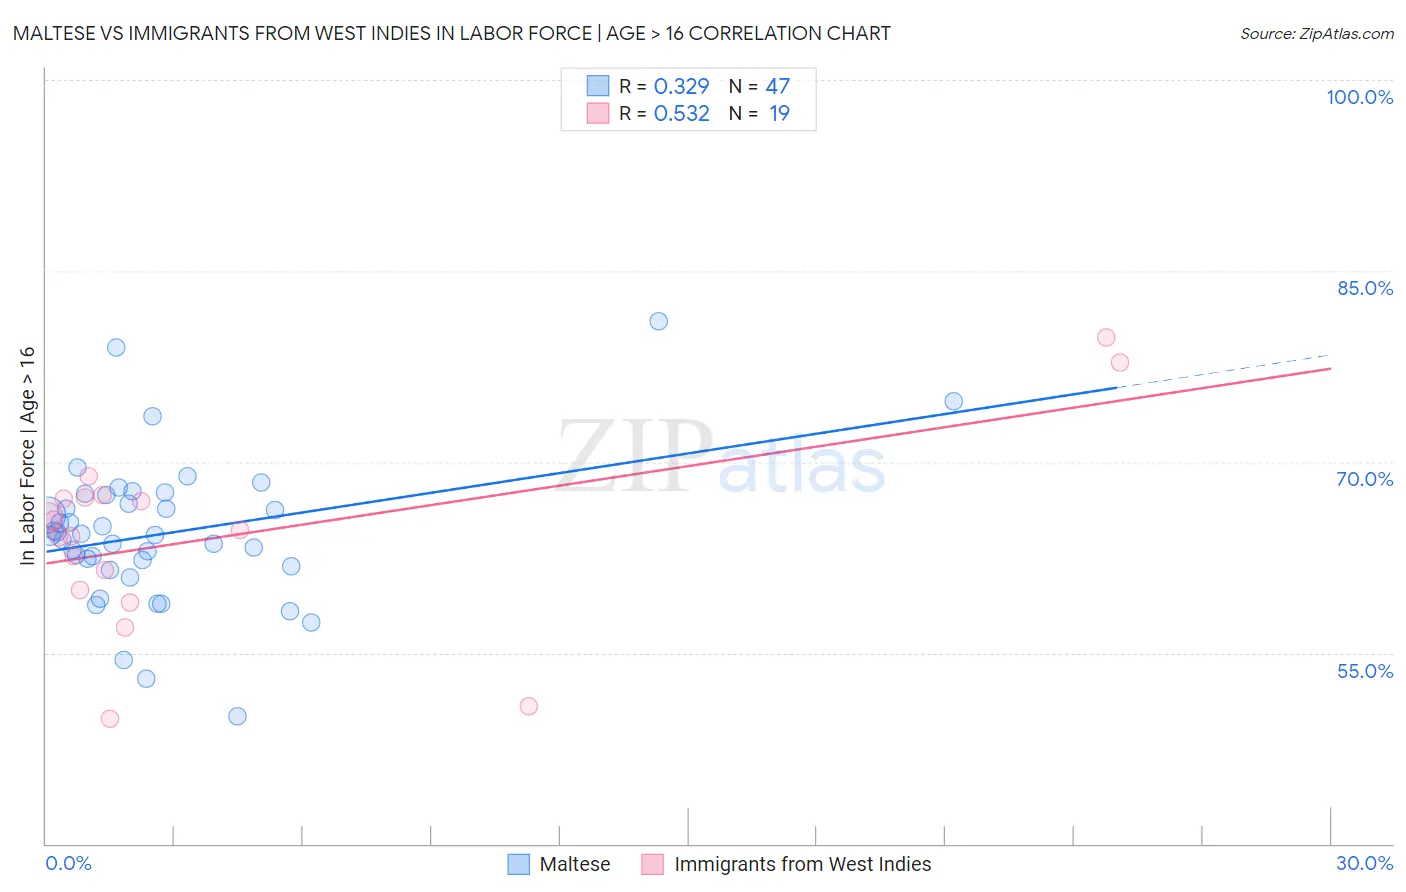
Maltese vs Immigrants from West Indies In Labor Force | Age > 16 Correlation Chart
The statistical analysis conducted on geographies consisting of 126,477,906 people shows a mild positive correlation between the proportion of Maltese and labor force participation rate among population ages 16 and over in the United States with a correlation coefficient (R) of 0.329 and weighted average of 64.8%. Similarly, the statistical analysis conducted on geographies consisting of 72,456,461 people shows a substantial positive correlation between the proportion of Immigrants from West Indies and labor force participation rate among population ages 16 and over in the United States with a correlation coefficient (R) of 0.532 and weighted average of 65.6%, a difference of 1.2%.
In Labor Force | Age > 16 Correlation Summary
| Measurement | Maltese | Immigrants from West Indies |
| Minimum | 50.0% | 49.8% |
| Maximum | 81.0% | 79.8% |
| Range | 31.0% | 30.0% |
| Mean | 64.4% | 64.2% |
| Median | 64.3% | 64.6% |
| Interquartile 25% (IQ1) | 61.8% | 60.0% |
| Interquartile 75% (IQ3) | 67.4% | 67.2% |
| Interquartile Range (IQR) | 5.6% | 7.2% |
| Standard Deviation (Sample) | 5.7% | 7.4% |
| Standard Deviation (Population) | 5.7% | 7.2% |
Similar Demographics by In Labor Force | Age > 16
Demographics Similar to Maltese by In Labor Force | Age > 16
In terms of in labor force | age > 16, the demographic groups most similar to Maltese are Alaskan Athabascan (64.8%, a difference of 0.0%), Fijian (64.8%, a difference of 0.010%), Immigrants from Denmark (64.8%, a difference of 0.020%), Estonian (64.8%, a difference of 0.020%), and Immigrants from Trinidad and Tobago (64.8%, a difference of 0.040%).
| Demographics | Rating | Rank | In Labor Force | Age > 16 |
| Lithuanians | 17.4 /100 | #206 | Poor 64.8% |
| Immigrants | Latin America | 16.4 /100 | #207 | Poor 64.8% |
| Belizeans | 16.2 /100 | #208 | Poor 64.8% |
| Immigrants | Trinidad and Tobago | 15.6 /100 | #209 | Poor 64.8% |
| Immigrants | Denmark | 14.7 /100 | #210 | Poor 64.8% |
| Fijians | 14.1 /100 | #211 | Poor 64.8% |
| Alaskan Athabascans | 13.9 /100 | #212 | Poor 64.8% |
| Maltese | 13.8 /100 | #213 | Poor 64.8% |
| Estonians | 13.1 /100 | #214 | Poor 64.8% |
| Immigrants | Czechoslovakia | 12.3 /100 | #215 | Poor 64.8% |
| Belgians | 11.4 /100 | #216 | Poor 64.7% |
| U.S. Virgin Islanders | 11.3 /100 | #217 | Poor 64.7% |
| Alsatians | 10.7 /100 | #218 | Poor 64.7% |
| Immigrants | Central America | 10.5 /100 | #219 | Poor 64.7% |
| Alaska Natives | 9.9 /100 | #220 | Tragic 64.7% |
Demographics Similar to Immigrants from West Indies by In Labor Force | Age > 16
In terms of in labor force | age > 16, the demographic groups most similar to Immigrants from West Indies are Guamanian/Chamorro (65.6%, a difference of 0.010%), Guatemalan (65.6%, a difference of 0.020%), Immigrants from Argentina (65.6%, a difference of 0.020%), Immigrants from Taiwan (65.5%, a difference of 0.040%), and Costa Rican (65.6%, a difference of 0.050%).
| Demographics | Rating | Rank | In Labor Force | Age > 16 |
| Icelanders | 94.3 /100 | #131 | Exceptional 65.6% |
| Immigrants | North Macedonia | 94.1 /100 | #132 | Exceptional 65.6% |
| Immigrants | Lithuania | 93.5 /100 | #133 | Exceptional 65.6% |
| Costa Ricans | 93.2 /100 | #134 | Exceptional 65.6% |
| Guatemalans | 92.5 /100 | #135 | Exceptional 65.6% |
| Immigrants | Argentina | 92.4 /100 | #136 | Exceptional 65.6% |
| Guamanians/Chamorros | 92.4 /100 | #137 | Exceptional 65.6% |
| Immigrants | West Indies | 92.0 /100 | #138 | Exceptional 65.6% |
| Immigrants | Taiwan | 90.8 /100 | #139 | Exceptional 65.5% |
| Immigrants | Costa Rica | 90.8 /100 | #140 | Exceptional 65.5% |
| Samoans | 90.5 /100 | #141 | Exceptional 65.5% |
| Indians (Asian) | 89.5 /100 | #142 | Excellent 65.5% |
| Latvians | 89.4 /100 | #143 | Excellent 65.5% |
| Immigrants | Romania | 88.6 /100 | #144 | Excellent 65.5% |
| Tlingit-Haida | 88.3 /100 | #145 | Excellent 65.5% |