Immigrants from Colombia vs Immigrants from West Indies In Labor Force | Age > 16
COMPARE
Immigrants from Colombia
Immigrants from West Indies
In Labor Force | Age > 16
In Labor Force | Age > 16 Comparison
Immigrants from Colombia
Immigrants from West Indies
65.9%
IN LABOR FORCE | AGE > 16
98.6/ 100
METRIC RATING
101st/ 347
METRIC RANK
65.6%
IN LABOR FORCE | AGE > 16
92.0/ 100
METRIC RATING
138th/ 347
METRIC RANK
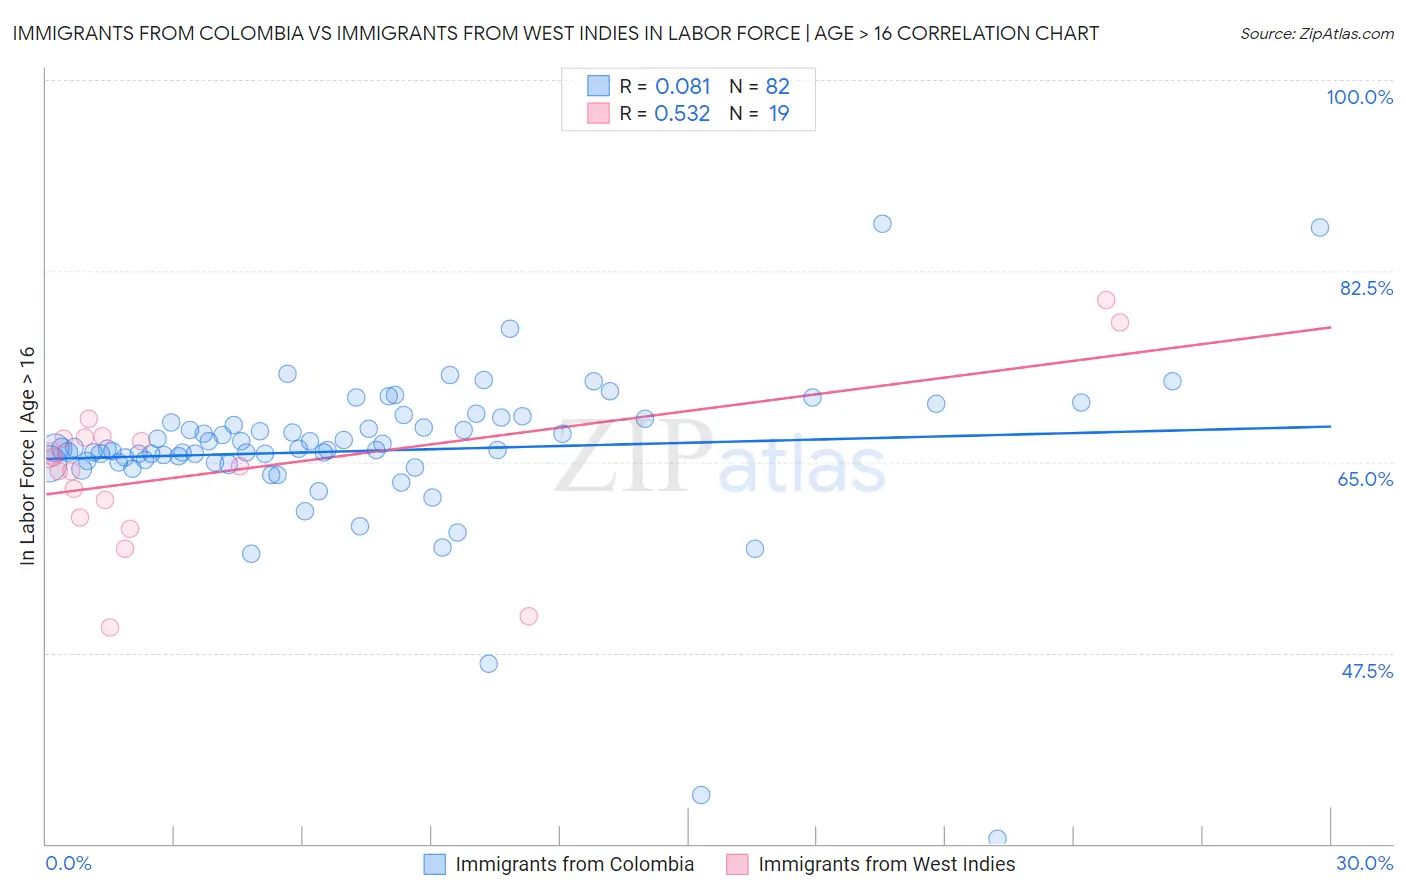
Immigrants from Colombia vs Immigrants from West Indies In Labor Force | Age > 16 Correlation Chart
The statistical analysis conducted on geographies consisting of 378,682,323 people shows a slight positive correlation between the proportion of Immigrants from Colombia and labor force participation rate among population ages 16 and over in the United States with a correlation coefficient (R) of 0.081 and weighted average of 65.9%. Similarly, the statistical analysis conducted on geographies consisting of 72,456,461 people shows a substantial positive correlation between the proportion of Immigrants from West Indies and labor force participation rate among population ages 16 and over in the United States with a correlation coefficient (R) of 0.532 and weighted average of 65.6%, a difference of 0.51%.
In Labor Force | Age > 16 Correlation Summary
| Measurement | Immigrants from Colombia | Immigrants from West Indies |
| Minimum | 30.5% | 49.8% |
| Maximum | 86.8% | 79.8% |
| Range | 56.3% | 30.0% |
| Mean | 66.0% | 64.2% |
| Median | 66.2% | 64.6% |
| Interquartile 25% (IQ1) | 65.0% | 60.0% |
| Interquartile 75% (IQ3) | 68.6% | 67.2% |
| Interquartile Range (IQR) | 3.6% | 7.2% |
| Standard Deviation (Sample) | 7.5% | 7.4% |
| Standard Deviation (Population) | 7.4% | 7.2% |
Similar Demographics by In Labor Force | Age > 16
Demographics Similar to Immigrants from Colombia by In Labor Force | Age > 16
In terms of in labor force | age > 16, the demographic groups most similar to Immigrants from Colombia are Uruguayan (65.9%, a difference of 0.0%), Immigrants from Australia (65.9%, a difference of 0.010%), Okinawan (65.9%, a difference of 0.010%), Immigrants from Chile (65.9%, a difference of 0.020%), and Immigrants from South Eastern Asia (65.9%, a difference of 0.020%).
| Demographics | Rating | Rank | In Labor Force | Age > 16 |
| Immigrants | Cambodia | 99.1 /100 | #94 | Exceptional 66.0% |
| Immigrants | Uruguay | 99.1 /100 | #95 | Exceptional 66.0% |
| Bangladeshis | 98.9 /100 | #96 | Exceptional 65.9% |
| Filipinos | 98.9 /100 | #97 | Exceptional 65.9% |
| Immigrants | Chile | 98.7 /100 | #98 | Exceptional 65.9% |
| Immigrants | Australia | 98.7 /100 | #99 | Exceptional 65.9% |
| Okinawans | 98.7 /100 | #100 | Exceptional 65.9% |
| Immigrants | Colombia | 98.6 /100 | #101 | Exceptional 65.9% |
| Uruguayans | 98.6 /100 | #102 | Exceptional 65.9% |
| Immigrants | South Eastern Asia | 98.5 /100 | #103 | Exceptional 65.9% |
| Palestinians | 98.5 /100 | #104 | Exceptional 65.9% |
| Colombians | 98.4 /100 | #105 | Exceptional 65.9% |
| Immigrants | Serbia | 98.1 /100 | #106 | Exceptional 65.8% |
| Immigrants | Poland | 98.1 /100 | #107 | Exceptional 65.8% |
| Immigrants | Spain | 98.0 /100 | #108 | Exceptional 65.8% |
Demographics Similar to Immigrants from West Indies by In Labor Force | Age > 16
In terms of in labor force | age > 16, the demographic groups most similar to Immigrants from West Indies are Guamanian/Chamorro (65.6%, a difference of 0.010%), Guatemalan (65.6%, a difference of 0.020%), Immigrants from Argentina (65.6%, a difference of 0.020%), Immigrants from Taiwan (65.5%, a difference of 0.040%), and Costa Rican (65.6%, a difference of 0.050%).
| Demographics | Rating | Rank | In Labor Force | Age > 16 |
| Icelanders | 94.3 /100 | #131 | Exceptional 65.6% |
| Immigrants | North Macedonia | 94.1 /100 | #132 | Exceptional 65.6% |
| Immigrants | Lithuania | 93.5 /100 | #133 | Exceptional 65.6% |
| Costa Ricans | 93.2 /100 | #134 | Exceptional 65.6% |
| Guatemalans | 92.5 /100 | #135 | Exceptional 65.6% |
| Immigrants | Argentina | 92.4 /100 | #136 | Exceptional 65.6% |
| Guamanians/Chamorros | 92.4 /100 | #137 | Exceptional 65.6% |
| Immigrants | West Indies | 92.0 /100 | #138 | Exceptional 65.6% |
| Immigrants | Taiwan | 90.8 /100 | #139 | Exceptional 65.5% |
| Immigrants | Costa Rica | 90.8 /100 | #140 | Exceptional 65.5% |
| Samoans | 90.5 /100 | #141 | Exceptional 65.5% |
| Indians (Asian) | 89.5 /100 | #142 | Excellent 65.5% |
| Latvians | 89.4 /100 | #143 | Excellent 65.5% |
| Immigrants | Romania | 88.6 /100 | #144 | Excellent 65.5% |
| Tlingit-Haida | 88.3 /100 | #145 | Excellent 65.5% |