Immigrants from Thailand vs Shoshone In Labor Force | Age > 16
COMPARE
Immigrants from Thailand
Shoshone
In Labor Force | Age > 16
In Labor Force | Age > 16 Comparison
Immigrants from Thailand
Shoshone
65.7%
IN LABOR FORCE | AGE > 16
96.6/ 100
METRIC RATING
118th/ 347
METRIC RANK
63.2%
IN LABOR FORCE | AGE > 16
0.0/ 100
METRIC RATING
310th/ 347
METRIC RANK
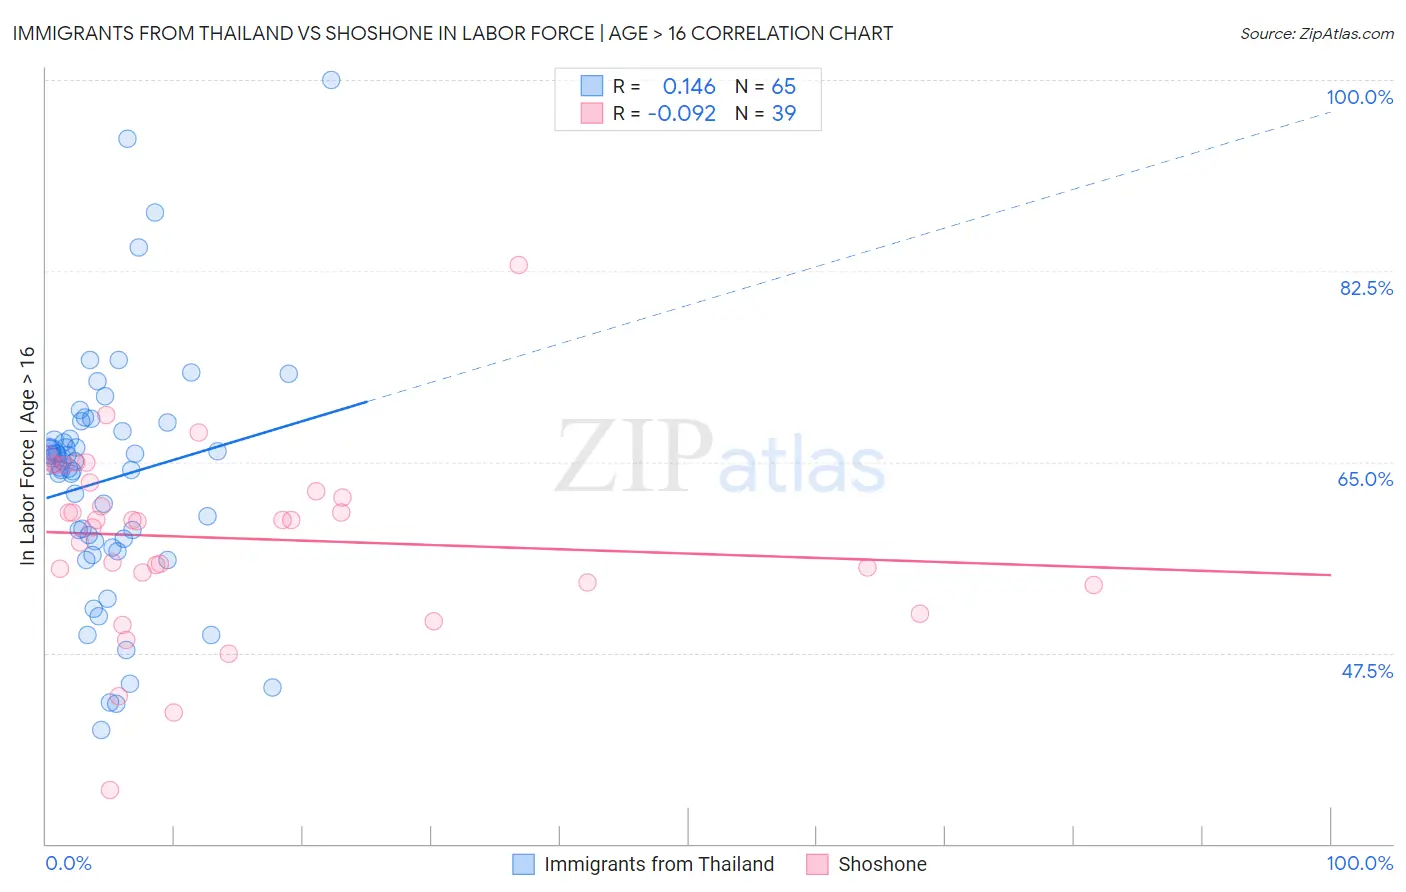
Immigrants from Thailand vs Shoshone In Labor Force | Age > 16 Correlation Chart
The statistical analysis conducted on geographies consisting of 317,023,360 people shows a poor positive correlation between the proportion of Immigrants from Thailand and labor force participation rate among population ages 16 and over in the United States with a correlation coefficient (R) of 0.146 and weighted average of 65.7%. Similarly, the statistical analysis conducted on geographies consisting of 66,627,221 people shows a slight negative correlation between the proportion of Shoshone and labor force participation rate among population ages 16 and over in the United States with a correlation coefficient (R) of -0.092 and weighted average of 63.2%, a difference of 4.0%.
In Labor Force | Age > 16 Correlation Summary
| Measurement | Immigrants from Thailand | Shoshone |
| Minimum | 40.4% | 34.9% |
| Maximum | 100.0% | 83.0% |
| Range | 59.6% | 48.1% |
| Mean | 63.4% | 58.0% |
| Median | 65.1% | 59.7% |
| Interquartile 25% (IQ1) | 57.4% | 54.0% |
| Interquartile 75% (IQ3) | 67.5% | 63.1% |
| Interquartile Range (IQR) | 10.1% | 9.1% |
| Standard Deviation (Sample) | 11.0% | 8.4% |
| Standard Deviation (Population) | 11.0% | 8.3% |
Similar Demographics by In Labor Force | Age > 16
Demographics Similar to Immigrants from Thailand by In Labor Force | Age > 16
In terms of in labor force | age > 16, the demographic groups most similar to Immigrants from Thailand are Immigrants from Iran (65.7%, a difference of 0.0%), Argentinean (65.7%, a difference of 0.010%), Immigrants from France (65.7%, a difference of 0.010%), Immigrants from Indonesia (65.7%, a difference of 0.020%), and Immigrants from Hong Kong (65.7%, a difference of 0.030%).
| Demographics | Rating | Rank | In Labor Force | Age > 16 |
| Immigrants | Honduras | 97.5 /100 | #111 | Exceptional 65.8% |
| Laotians | 97.4 /100 | #112 | Exceptional 65.8% |
| Pakistanis | 97.1 /100 | #113 | Exceptional 65.8% |
| Hondurans | 97.1 /100 | #114 | Exceptional 65.8% |
| Immigrants | Indonesia | 96.8 /100 | #115 | Exceptional 65.7% |
| Argentineans | 96.7 /100 | #116 | Exceptional 65.7% |
| Immigrants | Iran | 96.6 /100 | #117 | Exceptional 65.7% |
| Immigrants | Thailand | 96.6 /100 | #118 | Exceptional 65.7% |
| Immigrants | France | 96.4 /100 | #119 | Exceptional 65.7% |
| Immigrants | Hong Kong | 96.2 /100 | #120 | Exceptional 65.7% |
| New Zealanders | 96.0 /100 | #121 | Exceptional 65.7% |
| Immigrants | Ecuador | 95.9 /100 | #122 | Exceptional 65.7% |
| Immigrants | Iraq | 95.5 /100 | #123 | Exceptional 65.7% |
| Iraqis | 95.4 /100 | #124 | Exceptional 65.7% |
| Norwegians | 95.3 /100 | #125 | Exceptional 65.7% |
Demographics Similar to Shoshone by In Labor Force | Age > 16
In terms of in labor force | age > 16, the demographic groups most similar to Shoshone are Blackfeet (63.2%, a difference of 0.010%), Scotch-Irish (63.3%, a difference of 0.070%), Iroquois (63.2%, a difference of 0.070%), Pennsylvania German (63.4%, a difference of 0.20%), and Chippewa (63.1%, a difference of 0.20%).
| Demographics | Rating | Rank | In Labor Force | Age > 16 |
| Cree | 0.0 /100 | #303 | Tragic 63.5% |
| Immigrants | Nonimmigrants | 0.0 /100 | #304 | Tragic 63.5% |
| Osage | 0.0 /100 | #305 | Tragic 63.5% |
| Blacks/African Americans | 0.0 /100 | #306 | Tragic 63.4% |
| Central American Indians | 0.0 /100 | #307 | Tragic 63.4% |
| Pennsylvania Germans | 0.0 /100 | #308 | Tragic 63.4% |
| Scotch-Irish | 0.0 /100 | #309 | Tragic 63.3% |
| Shoshone | 0.0 /100 | #310 | Tragic 63.2% |
| Blackfeet | 0.0 /100 | #311 | Tragic 63.2% |
| Iroquois | 0.0 /100 | #312 | Tragic 63.2% |
| Chippewa | 0.0 /100 | #313 | Tragic 63.1% |
| Yaqui | 0.0 /100 | #314 | Tragic 63.0% |
| Potawatomi | 0.0 /100 | #315 | Tragic 62.8% |
| Yup'ik | 0.0 /100 | #316 | Tragic 62.7% |
| Kiowa | 0.0 /100 | #317 | Tragic 62.4% |