Immigrants from Thailand vs Immigrants from West Indies Householder Income Under 25 years
COMPARE
Immigrants from Thailand
Immigrants from West Indies
Householder Income Under 25 years
Householder Income Under 25 years Comparison
Immigrants from Thailand
Immigrants from West Indies
$50,645
HOUSEHOLDER INCOME UNDER 25 YEARS
2.2/ 100
METRIC RATING
243rd/ 347
METRIC RANK
$51,479
HOUSEHOLDER INCOME UNDER 25 YEARS
14.9/ 100
METRIC RATING
200th/ 347
METRIC RANK
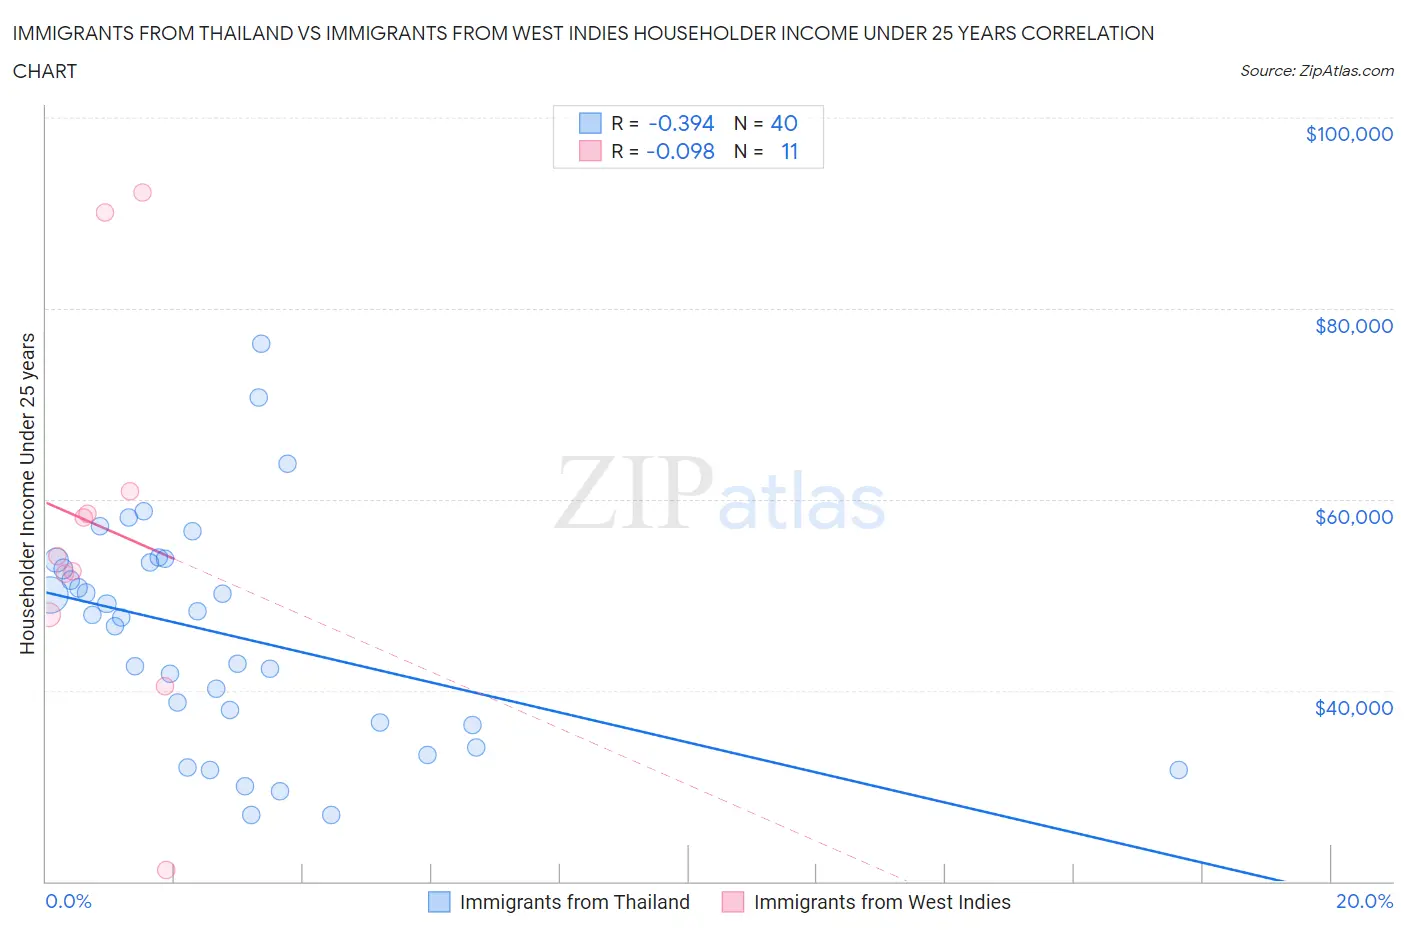
Immigrants from Thailand vs Immigrants from West Indies Householder Income Under 25 years Correlation Chart
The statistical analysis conducted on geographies consisting of 278,847,431 people shows a mild negative correlation between the proportion of Immigrants from Thailand and household income with householder under the age of 25 in the United States with a correlation coefficient (R) of -0.394 and weighted average of $50,645. Similarly, the statistical analysis conducted on geographies consisting of 67,649,285 people shows a slight negative correlation between the proportion of Immigrants from West Indies and household income with householder under the age of 25 in the United States with a correlation coefficient (R) of -0.098 and weighted average of $51,479, a difference of 1.7%.
Householder Income Under 25 years Correlation Summary
| Measurement | Immigrants from Thailand | Immigrants from West Indies |
| Minimum | $27,000 | $21,217 |
| Maximum | $76,250 | $92,155 |
| Range | $49,250 | $70,938 |
| Mean | $45,889 | $57,077 |
| Median | $47,771 | $54,070 |
| Interquartile 25% (IQ1) | $36,516 | $47,937 |
| Interquartile 75% (IQ3) | $53,502 | $60,906 |
| Interquartile Range (IQR) | $16,986 | $12,968 |
| Standard Deviation (Sample) | $11,714 | $20,093 |
| Standard Deviation (Population) | $11,567 | $19,158 |
Similar Demographics by Householder Income Under 25 years
Demographics Similar to Immigrants from Thailand by Householder Income Under 25 years
In terms of householder income under 25 years, the demographic groups most similar to Immigrants from Thailand are Cuban ($50,655, a difference of 0.020%), Marshallese ($50,627, a difference of 0.040%), Immigrants from Africa ($50,609, a difference of 0.070%), Immigrants from Micronesia ($50,691, a difference of 0.090%), and Welsh ($50,597, a difference of 0.10%).
| Demographics | Rating | Rank | Householder Income Under 25 years |
| English | 3.3 /100 | #236 | Tragic $50,805 |
| Germans | 3.3 /100 | #237 | Tragic $50,804 |
| Iraqis | 3.2 /100 | #238 | Tragic $50,802 |
| Immigrants | Caribbean | 2.9 /100 | #239 | Tragic $50,757 |
| Immigrants | Lebanon | 2.7 /100 | #240 | Tragic $50,729 |
| Immigrants | Micronesia | 2.5 /100 | #241 | Tragic $50,691 |
| Cubans | 2.3 /100 | #242 | Tragic $50,655 |
| Immigrants | Thailand | 2.2 /100 | #243 | Tragic $50,645 |
| Marshallese | 2.1 /100 | #244 | Tragic $50,627 |
| Immigrants | Africa | 2.0 /100 | #245 | Tragic $50,609 |
| Welsh | 2.0 /100 | #246 | Tragic $50,597 |
| Immigrants | Bosnia and Herzegovina | 1.8 /100 | #247 | Tragic $50,565 |
| Slavs | 1.8 /100 | #248 | Tragic $50,563 |
| Scottish | 1.8 /100 | #249 | Tragic $50,554 |
| Immigrants | Cabo Verde | 1.7 /100 | #250 | Tragic $50,520 |
Demographics Similar to Immigrants from West Indies by Householder Income Under 25 years
In terms of householder income under 25 years, the demographic groups most similar to Immigrants from West Indies are British ($51,477, a difference of 0.0%), Immigrants from Syria ($51,494, a difference of 0.030%), Swiss ($51,493, a difference of 0.030%), Pima ($51,503, a difference of 0.050%), and Immigrants from Guatemala ($51,447, a difference of 0.060%).
| Demographics | Rating | Rank | Householder Income Under 25 years |
| Immigrants | Eritrea | 18.1 /100 | #193 | Poor $51,574 |
| Guatemalans | 16.4 /100 | #194 | Poor $51,525 |
| Estonians | 16.4 /100 | #195 | Poor $51,523 |
| Palestinians | 16.1 /100 | #196 | Poor $51,515 |
| Pima | 15.7 /100 | #197 | Poor $51,503 |
| Immigrants | Syria | 15.4 /100 | #198 | Poor $51,494 |
| Swiss | 15.4 /100 | #199 | Poor $51,493 |
| Immigrants | West Indies | 14.9 /100 | #200 | Poor $51,479 |
| British | 14.9 /100 | #201 | Poor $51,477 |
| Immigrants | Guatemala | 14.0 /100 | #202 | Poor $51,447 |
| Immigrants | Cameroon | 13.6 /100 | #203 | Poor $51,433 |
| Czechs | 13.2 /100 | #204 | Poor $51,421 |
| Cape Verdeans | 12.3 /100 | #205 | Poor $51,387 |
| Immigrants | Latin America | 12.3 /100 | #206 | Poor $51,387 |
| South Africans | 12.2 /100 | #207 | Poor $51,383 |