Immigrants from Taiwan vs Bhutanese In Labor Force | Age 25-29
COMPARE
Immigrants from Taiwan
Bhutanese
In Labor Force | Age 25-29
In Labor Force | Age 25-29 Comparison
Immigrants from Taiwan
Bhutanese
84.7%
IN LABOR FORCE | AGE 25-29
62.2/ 100
METRIC RATING
153rd/ 347
METRIC RANK
84.8%
IN LABOR FORCE | AGE 25-29
76.0/ 100
METRIC RATING
136th/ 347
METRIC RANK
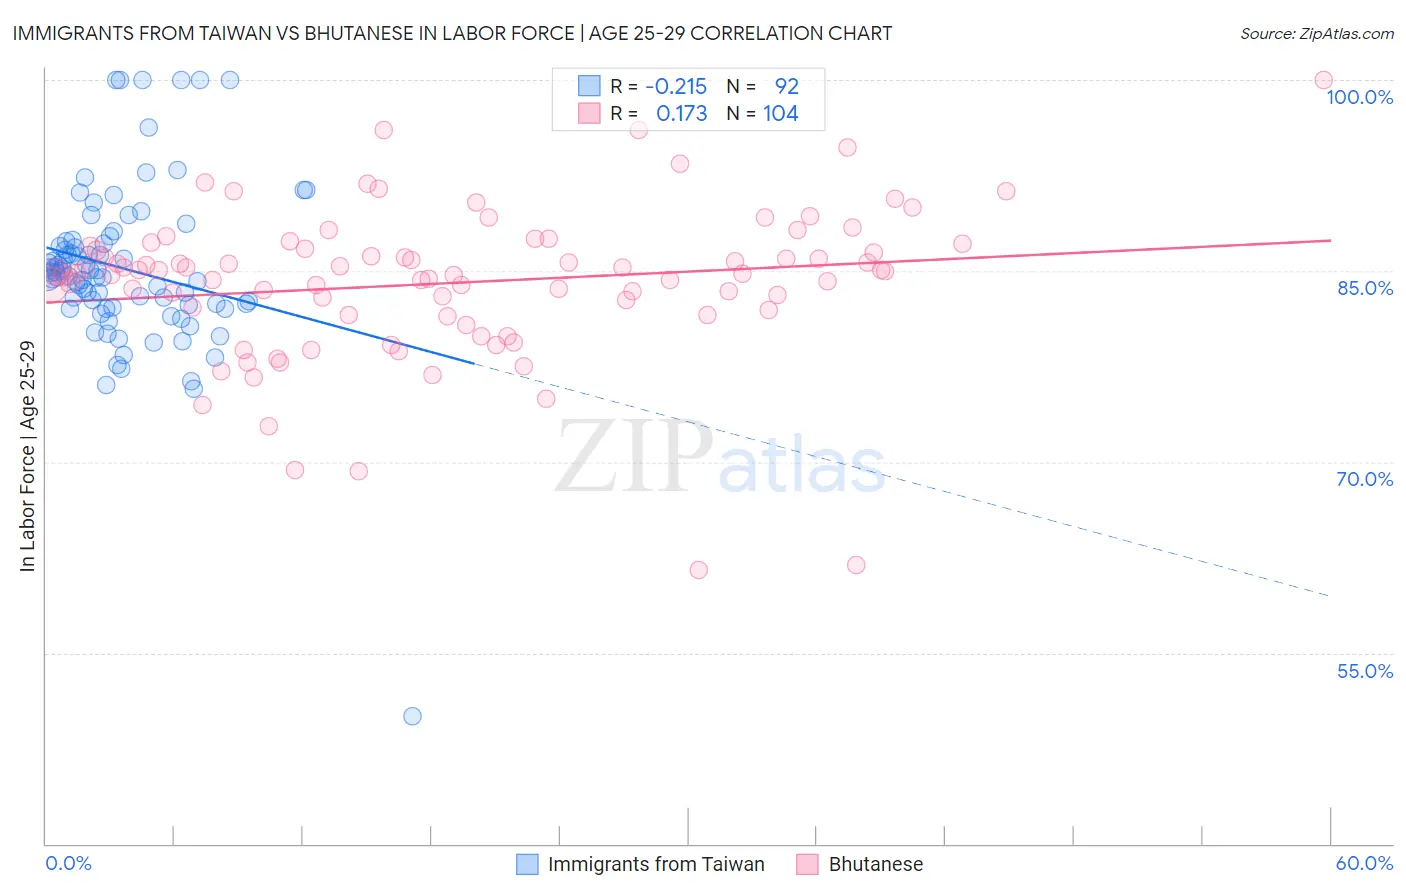
Immigrants from Taiwan vs Bhutanese In Labor Force | Age 25-29 Correlation Chart
The statistical analysis conducted on geographies consisting of 298,185,522 people shows a weak negative correlation between the proportion of Immigrants from Taiwan and labor force participation rate among population between the ages 25 and 29 in the United States with a correlation coefficient (R) of -0.215 and weighted average of 84.7%. Similarly, the statistical analysis conducted on geographies consisting of 455,304,238 people shows a poor positive correlation between the proportion of Bhutanese and labor force participation rate among population between the ages 25 and 29 in the United States with a correlation coefficient (R) of 0.173 and weighted average of 84.8%, a difference of 0.12%.
In Labor Force | Age 25-29 Correlation Summary
| Measurement | Immigrants from Taiwan | Bhutanese |
| Minimum | 50.0% | 61.5% |
| Maximum | 100.0% | 100.0% |
| Range | 50.0% | 38.5% |
| Mean | 85.2% | 84.1% |
| Median | 84.7% | 84.8% |
| Interquartile 25% (IQ1) | 82.3% | 81.7% |
| Interquartile 75% (IQ3) | 87.2% | 86.8% |
| Interquartile Range (IQR) | 5.0% | 5.1% |
| Standard Deviation (Sample) | 6.6% | 6.0% |
| Standard Deviation (Population) | 6.6% | 6.0% |
Demographics Similar to Immigrants from Taiwan and Bhutanese by In Labor Force | Age 25-29
In terms of in labor force | age 25-29, the demographic groups most similar to Immigrants from Taiwan are Colombian (84.7%, a difference of 0.0%), Immigrants from Pakistan (84.7%, a difference of 0.0%), Immigrants from Sri Lanka (84.7%, a difference of 0.0%), Immigrants from England (84.7%, a difference of 0.020%), and Peruvian (84.7%, a difference of 0.020%). Similarly, the demographic groups most similar to Bhutanese are Immigrants from Hungary (84.8%, a difference of 0.0%), Syrian (84.8%, a difference of 0.010%), Immigrants from Canada (84.8%, a difference of 0.020%), Armenian (84.8%, a difference of 0.030%), and Immigrants from Eastern Asia (84.8%, a difference of 0.030%).
| Demographics | Rating | Rank | In Labor Force | Age 25-29 |
| Syrians | 76.5 /100 | #134 | Good 84.8% |
| Immigrants | Hungary | 76.4 /100 | #135 | Good 84.8% |
| Bhutanese | 76.0 /100 | #136 | Good 84.8% |
| Immigrants | Canada | 73.5 /100 | #137 | Good 84.8% |
| Armenians | 72.7 /100 | #138 | Good 84.8% |
| Immigrants | Eastern Asia | 72.6 /100 | #139 | Good 84.8% |
| Immigrants | North America | 72.1 /100 | #140 | Good 84.8% |
| Danes | 71.9 /100 | #141 | Good 84.8% |
| Pakistanis | 70.0 /100 | #142 | Good 84.8% |
| Sri Lankans | 69.2 /100 | #143 | Good 84.8% |
| Immigrants | Laos | 69.0 /100 | #144 | Good 84.8% |
| Immigrants | Senegal | 68.3 /100 | #145 | Good 84.8% |
| Icelanders | 68.2 /100 | #146 | Good 84.8% |
| Immigrants | Asia | 68.2 /100 | #147 | Good 84.8% |
| Immigrants | England | 65.2 /100 | #148 | Good 84.7% |
| Peruvians | 64.7 /100 | #149 | Good 84.7% |
| Swiss | 64.7 /100 | #150 | Good 84.7% |
| Colombians | 62.8 /100 | #151 | Good 84.7% |
| Immigrants | Pakistan | 62.7 /100 | #152 | Good 84.7% |
| Immigrants | Taiwan | 62.2 /100 | #153 | Good 84.7% |
| Immigrants | Sri Lanka | 61.7 /100 | #154 | Good 84.7% |