Immigrants from Taiwan vs Spaniard In Labor Force | Age 45-54

COMPARE

Immigrants from Taiwan
Race
Ancestry
AfghanAfricanAlaska NativeAlaskan AthabascanAlbanianAleutAlsatianAmericanApacheArabArapahoArgentineanArmenianAssyrian/Chaldean/SyriacAustralianAustrianBahamianBangladeshiBarbadianBasqueBelgianBelizeanBermudanBhutaneseBlackfeetBolivianBrazilianBritishBritish West IndianBulgarianBurmeseCajunCambodianCanadianCape VerdeanCarpatho RusynCelticCentral AmericanCentral American IndianCherokeeCheyenneChickasawChileanChineseChippewaChoctawColombianColvilleComancheCosta RicanCreeCreekCroatianCrowCubanCypriotCzechCzechoslovakianDanishDelawareDominicanDutchDutch West IndianEastern EuropeanEcuadorianEgyptianEnglishEstonianEthiopianEuropeanFijianFilipinoFinnishFrenchFrench American IndianFrench CanadianGermanGerman RussianGhanaianGreekGuamanian/ChamorroGuatemalanGuyaneseHaitianHmongHonduranHopiHoumaHungarianIcelanderIndian (Asian)IndonesianInupiatIranianIraqiIrishIroquoisIsraeliItalianJamaicanJapaneseJordanianKenyanKiowaKoreanLaotianLatvianLebaneseLiberianLithuanianLumbeeLuxembourgerMacedonianMalaysianMalteseMarshalleseMenomineeMexicanMexican American IndianMongolianMoroccanNative HawaiianNavajoNepaleseNew ZealanderNicaraguanNigerianNorthern EuropeanNorwegianOkinawanOsageOttawaPaiutePakistaniPalestinianPanamanianParaguayanPennsylvania GermanPeruvianPimaPolishPortuguesePotawatomiPuebloPuerto RicanPuget Sound SalishRomanianRussianSalvadoranSamoanScandinavianScotch-IrishScottishSeminoleSenegaleseSerbianShoshoneSierra LeoneanSiouxSlavicSlovakSloveneSomaliSouth AfricanSouth AmericanSouth American IndianSoviet UnionSpanishSpanish AmericanSpanish American IndianSri LankanSubsaharan AfricanSudaneseSwedishSwissSyrianTaiwaneseThaiTlingit-HaidaTohono O'OdhamTonganTrinidadian and TobagonianTsimshianTurkishU.S. Virgin IslanderUgandanUkrainianUruguayanUteVenezuelanVietnameseWelshWest IndianYakamaYaquiYugoslavianYumanYup'ikZimbabwean
Immigration
NonimmigrantsImmigrantsAfghanistanAfricaAlbaniaArgentinaArmeniaAsiaAustraliaAustriaBahamasBangladeshBarbadosBelarusBelgiumBelizeBoliviaBosnia and HerzegovinaBrazilBulgariaBurma/MyanmarCabo VerdeCambodiaCameroonCanadaCaribbeanCentral AmericaChileChinaColombiaCongoCosta RicaCroatiaCubaCzechoslovakiaDenmarkDominicaDominican RepublicEastern AfricaEastern AsiaEastern EuropeEcuadorEgyptEl SalvadorEnglandEritreaEthiopiaEuropeFijiFranceGermanyGhanaGreeceGrenadaGuatemalaGuyanaHaitiHondurasHong KongHungaryIndiaIndonesiaIranIraqIrelandIsraelItalyJamaicaJapanJordanKazakhstanKenyaKoreaKuwaitLaosLatin AmericaLatviaLebanonLiberiaLithuaniaMalaysiaMexicoMicronesiaMiddle AfricaMoldovaMoroccoNepalNetherlandsNicaraguaNigeriaNorth AmericaNorth MacedoniaNorthern AfricaNorthern EuropeNorwayOceaniaPakistanPanamaPeruPhilippinesPolandPortugalRomaniaRussiaSaudi ArabiaScotlandSenegalSerbiaSierra LeoneSingaporeSomaliaSouth AfricaSouth AmericaSouth Central AsiaSouth Eastern AsiaSouthern EuropeSpainSri LankaSt. Vincent and the GrenadinesSudanSwedenSwitzerlandSyriaTaiwanThailandTrinidad and TobagoTurkeyUgandaUkraineUruguayUzbekistanVenezuelaVietnamWest IndiesWestern AfricaWestern AsiaWestern EuropeYemenZaireZimbabweAzores
Spaniard
Race
Ancestry
AfghanAfricanAlaska NativeAlaskan AthabascanAlbanianAleutAlsatianAmericanApacheArabArapahoArgentineanArmenianAssyrian/Chaldean/SyriacAustralianAustrianBahamianBangladeshiBarbadianBasqueBelgianBelizeanBermudanBhutaneseBlackfeetBolivianBrazilianBritishBritish West IndianBulgarianBurmeseCajunCambodianCanadianCape VerdeanCarpatho RusynCelticCentral AmericanCentral American IndianCherokeeCheyenneChickasawChileanChineseChippewaChoctawColombianColvilleComancheCosta RicanCreeCreekCroatianCrowCubanCypriotCzechCzechoslovakianDanishDelawareDominicanDutchDutch West IndianEastern EuropeanEcuadorianEgyptianEnglishEstonianEthiopianEuropeanFijianFilipinoFinnishFrenchFrench American IndianFrench CanadianGermanGerman RussianGhanaianGreekGuamanian/ChamorroGuatemalanGuyaneseHaitianHmongHonduranHopiHoumaHungarianIcelanderIndian (Asian)IndonesianInupiatIranianIraqiIrishIroquoisIsraeliItalianJamaicanJapaneseJordanianKenyanKiowaKoreanLaotianLatvianLebaneseLiberianLithuanianLumbeeLuxembourgerMacedonianMalaysianMalteseMarshalleseMenomineeMexicanMexican American IndianMongolianMoroccanNative HawaiianNavajoNepaleseNew ZealanderNicaraguanNigerianNorthern EuropeanNorwegianOkinawanOsageOttawaPaiutePakistaniPalestinianPanamanianParaguayanPennsylvania GermanPeruvianPimaPolishPortuguesePotawatomiPuebloPuerto RicanPuget Sound SalishRomanianRussianSalvadoranSamoanScandinavianScotch-IrishScottishSeminoleSenegaleseSerbianShoshoneSierra LeoneanSiouxSlavicSlovakSloveneSomaliSouth AfricanSouth AmericanSouth American IndianSoviet UnionSpaniardSpanishSpanish AmericanSpanish American IndianSri LankanSubsaharan AfricanSudaneseSwedishSwissSyrianTaiwaneseThaiTlingit-HaidaTohono O'OdhamTonganTrinidadian and TobagonianTsimshianTurkishU.S. Virgin IslanderUgandanUkrainianUruguayanUteVenezuelanVietnameseWelshWest IndianYakamaYaquiYugoslavianYumanYup'ikZimbabwean
Immigration
NonimmigrantsImmigrantsAfghanistanAfricaAlbaniaArgentinaArmeniaAsiaAustraliaAustriaBahamasBangladeshBarbadosBelarusBelgiumBelizeBoliviaBosnia and HerzegovinaBrazilBulgariaBurma/MyanmarCabo VerdeCambodiaCameroonCanadaCaribbeanCentral AmericaChileChinaColombiaCongoCosta RicaCroatiaCubaCzechoslovakiaDenmarkDominicaDominican RepublicEastern AfricaEastern AsiaEastern EuropeEcuadorEgyptEl SalvadorEnglandEritreaEthiopiaEuropeFijiFranceGermanyGhanaGreeceGrenadaGuatemalaGuyanaHaitiHondurasHong KongHungaryIndiaIndonesiaIranIraqIrelandIsraelItalyJamaicaJapanJordanKazakhstanKenyaKoreaKuwaitLaosLatin AmericaLatviaLebanonLiberiaLithuaniaMalaysiaMexicoMicronesiaMiddle AfricaMoldovaMoroccoNepalNetherlandsNicaraguaNigeriaNorth AmericaNorth MacedoniaNorthern AfricaNorthern EuropeNorwayOceaniaPakistanPanamaPeruPhilippinesPolandPortugalRomaniaRussiaSaudi ArabiaScotlandSenegalSerbiaSierra LeoneSingaporeSomaliaSouth AfricaSouth AmericaSouth Central AsiaSouth Eastern AsiaSouthern EuropeSpainSri LankaSt. Vincent and the GrenadinesSudanSwedenSwitzerlandSyriaThailandTrinidad and TobagoTurkeyUgandaUkraineUruguayUzbekistanVenezuelaVietnamWest IndiesWestern AfricaWestern AsiaWestern EuropeYemenZaireZimbabweAzores
In Labor Force | Age 45-54
Income
Poverty
Unemployment
Labor Participation
Family Structure
Vehicle Availability
Education Level
Disability

In Labor Force | Age 45-54 Comparison

Immigrants from Taiwan

Spaniards

Exceptional
Tragic
83.5%
IN LABOR FORCE | AGE 45-54
98.0/ 100
METRIC RATING
62nd/ 347
METRIC RANK
81.5%
IN LABOR FORCE | AGE 45-54
0.1/ 100
METRIC RATING
260th/ 347
METRIC RANK

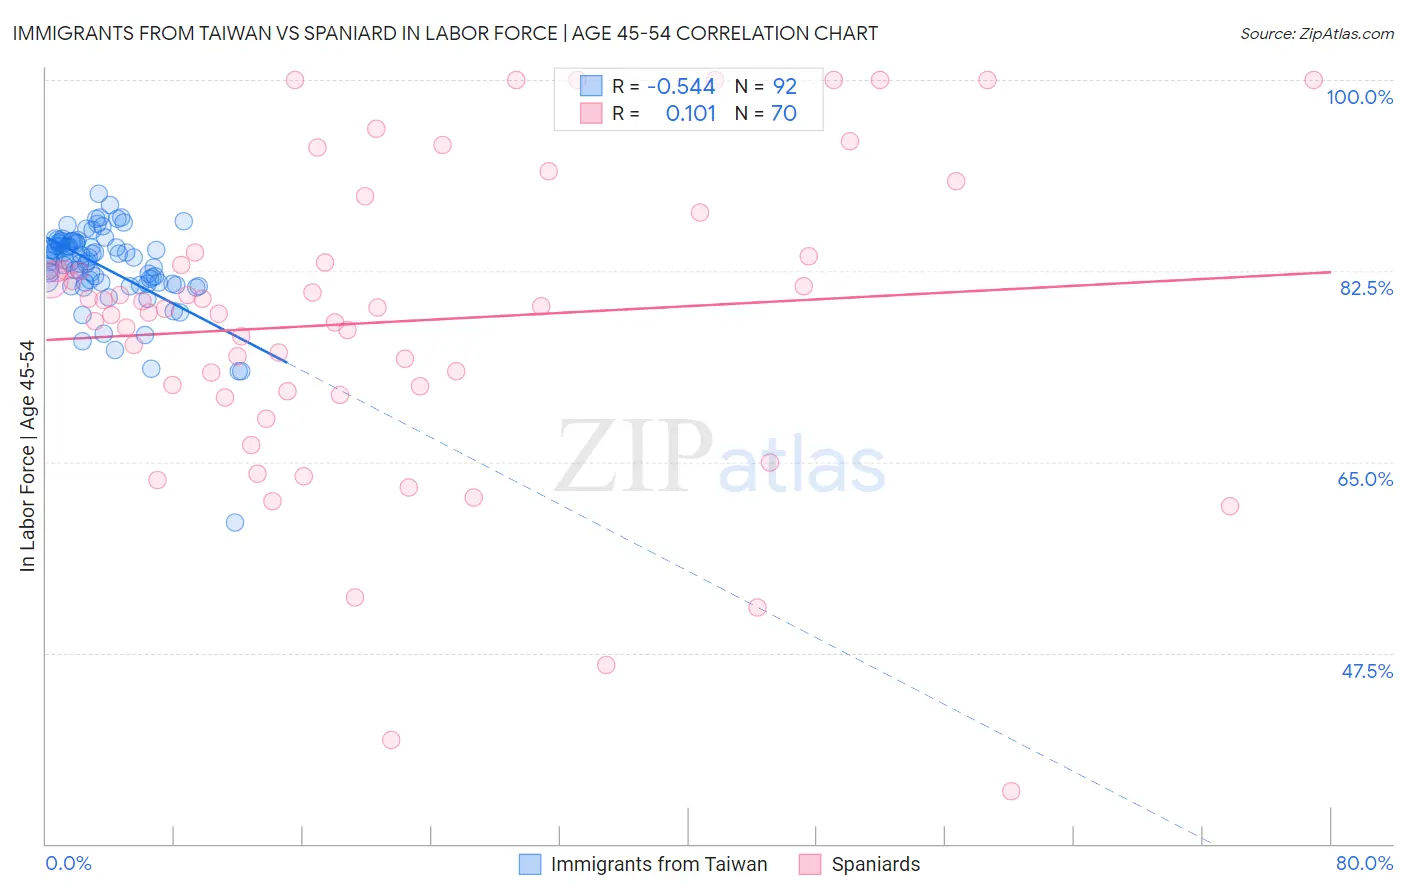
Immigrants from Taiwan vs Spaniard In Labor Force | Age 45-54 Correlation Chart

The statistical analysis conducted on geographies consisting of 298,127,806 people shows a substantial negative correlation between the proportion of Immigrants from Taiwan and labor force participation rate among population between the ages 45 and 54 in the United States with a correlation coefficient (R) of -0.544 and weighted average of 83.5%. Similarly, the statistical analysis conducted on geographies consisting of 443,105,188 people shows a poor positive correlation between the proportion of Spaniards and labor force participation rate among population between the ages 45 and 54 in the United States with a correlation coefficient (R) of 0.101 and weighted average of 81.5%, a difference of 2.4%.
Immigrants from Taiwan vs Spaniard In Labor Force | Age 45-54

In Labor Force | Age 45-54 Correlation Summary

MeasurementImmigrants from TaiwanSpaniard
Minimum59.5%34.8%
Maximum89.6%100.0%
Range30.1%65.2%
Mean82.8%77.9%
Median83.7%79.1%
Interquartile 25% (IQ1)81.4%71.5%
Interquartile 75% (IQ3)85.1%83.8%
Interquartile Range (IQR)3.7%12.3%
Standard Deviation (Sample)4.0%14.2%
Standard Deviation (Population)4.0%14.1%

Similar Demographics by In Labor Force | Age 45-54

Demographics Similar to Immigrants from Taiwan by In Labor Force | Age 45-54

In terms of in labor force | age 45-54, the demographic groups most similar to Immigrants from Taiwan are Afghan (83.5%, a difference of 0.010%), Immigrants from Kenya (83.5%, a difference of 0.010%), Egyptian (83.5%, a difference of 0.020%), Carpatho Rusyn (83.5%, a difference of 0.030%), and Filipino (83.5%, a difference of 0.030%).
DemographicsRating | RankIn Labor Force | Age 45-54
Macedonians
98.7
/100
|
#55
Exceptional
83.5%
Immigrants | Peru
98.6
/100
|
#56
Exceptional
83.5%
Paraguayans
98.5
/100
|
#57
Exceptional
83.5%
Eastern Europeans
98.5
/100
|
#58
Exceptional
83.5%
Bhutanese
98.3
/100
|
#59
Exceptional
83.5%
Carpatho Rusyns
98.3
/100
|
#60
Exceptional
83.5%
Filipinos
98.3
/100
|
#61
Exceptional
83.5%
Immigrants | Taiwan
98.0
/100
|
#62
Exceptional
83.5%
Afghans
97.9
/100
|
#63
Exceptional
83.5%
Immigrants | Kenya
97.9
/100
|
#64
Exceptional
83.5%
Egyptians
97.9
/100
|
#65
Exceptional
83.5%
Asians
97.7
/100
|
#66
Exceptional
83.4%
Chileans
97.7
/100
|
#67
Exceptional
83.4%
Immigrants | Colombia
97.6
/100
|
#68
Exceptional
83.4%
Taiwanese
97.5
/100
|
#69
Exceptional
83.4%

Demographics Similar to Spaniards by In Labor Force | Age 45-54

In terms of in labor force | age 45-54, the demographic groups most similar to Spaniards are Hawaiian (81.5%, a difference of 0.020%), Immigrants from Guyana (81.5%, a difference of 0.020%), Immigrants from Fiji (81.5%, a difference of 0.030%), Guyanese (81.5%, a difference of 0.030%), and Indonesian (81.5%, a difference of 0.030%).
DemographicsRating | RankIn Labor Force | Age 45-54
Japanese
0.2
/100
|
#253
Tragic
81.6%
Immigrants | Laos
0.2
/100
|
#254
Tragic
81.6%
Scotch-Irish
0.2
/100
|
#255
Tragic
81.6%
Barbadians
0.1
/100
|
#256
Tragic
81.6%
Immigrants | Congo
0.1
/100
|
#257
Tragic
81.6%
Immigrants | Fiji
0.1
/100
|
#258
Tragic
81.5%
Guyanese
0.1
/100
|
#259
Tragic
81.5%
Spaniards
0.1
/100
|
#260
Tragic
81.5%
Hawaiians
0.1
/100
|
#261
Tragic
81.5%
Immigrants | Guyana
0.1
/100
|
#262
Tragic
81.5%
Indonesians
0.1
/100
|
#263
Tragic
81.5%
Immigrants | West Indies
0.1
/100
|
#264
Tragic
81.5%
Hondurans
0.1
/100
|
#265
Tragic
81.4%
Immigrants | St. Vincent and the Grenadines
0.1
/100
|
#266
Tragic
81.4%
West Indians
0.1
/100
|
#267
Tragic
81.4%