Immigrants from Taiwan vs Spaniard Self-Care Disability
COMPARE
Immigrants from Taiwan
Spaniard
Self-Care Disability
Self-Care Disability Comparison
Immigrants from Taiwan
Spaniards
2.2%
SELF-CARE DISABILITY
100.0/ 100
METRIC RATING
18th/ 347
METRIC RANK
2.6%
SELF-CARE DISABILITY
3.8/ 100
METRIC RATING
222nd/ 347
METRIC RANK
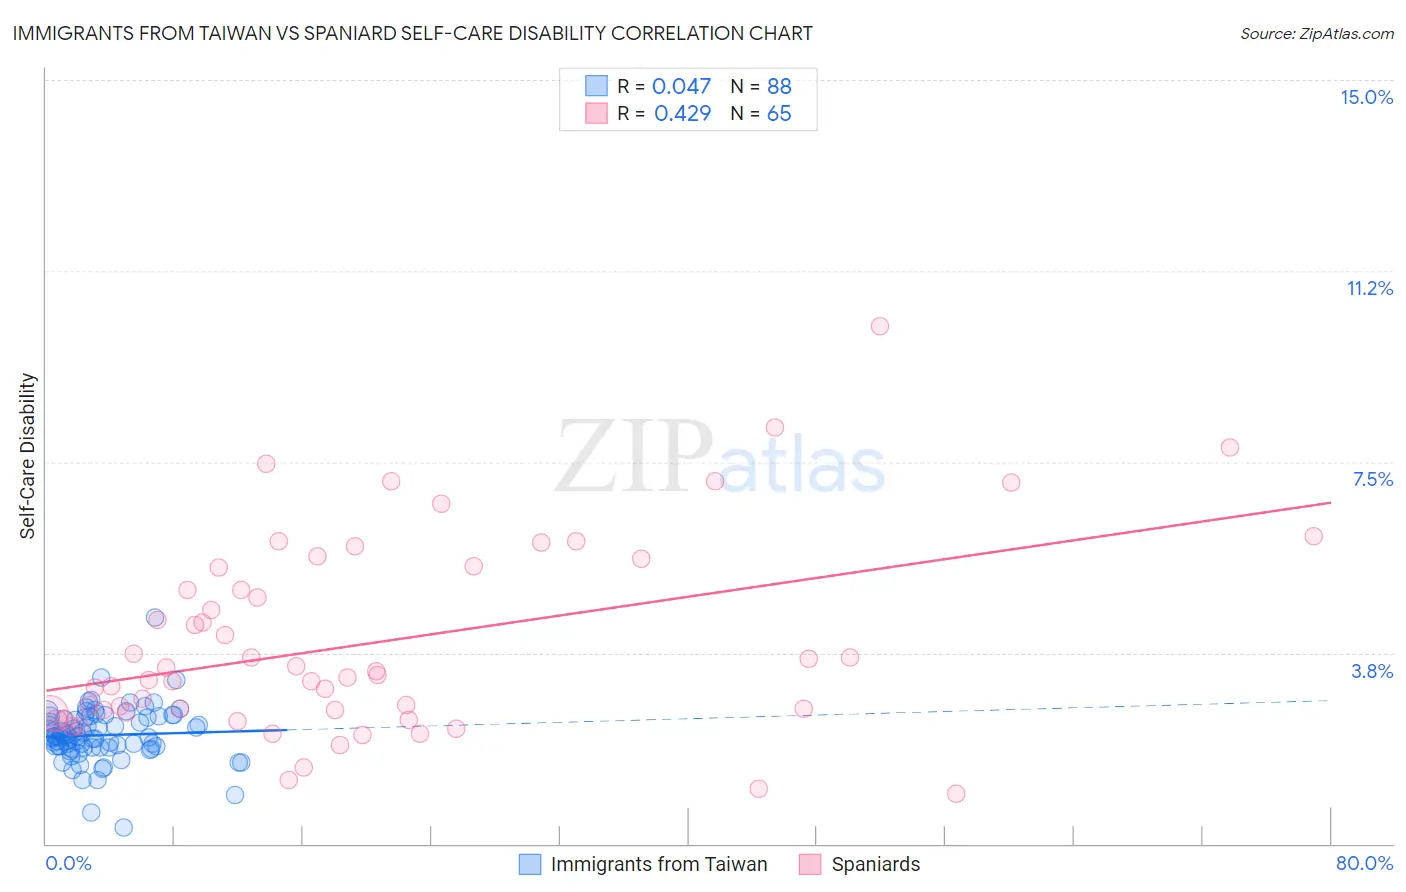
Immigrants from Taiwan vs Spaniard Self-Care Disability Correlation Chart
The statistical analysis conducted on geographies consisting of 297,966,372 people shows no correlation between the proportion of Immigrants from Taiwan and percentage of population with self-care disability in the United States with a correlation coefficient (R) of 0.047 and weighted average of 2.2%. Similarly, the statistical analysis conducted on geographies consisting of 442,715,832 people shows a moderate positive correlation between the proportion of Spaniards and percentage of population with self-care disability in the United States with a correlation coefficient (R) of 0.429 and weighted average of 2.6%, a difference of 15.7%.
Self-Care Disability Correlation Summary
| Measurement | Immigrants from Taiwan | Spaniard |
| Minimum | 0.31% | 0.97% |
| Maximum | 4.4% | 10.2% |
| Range | 4.1% | 9.2% |
| Mean | 2.1% | 3.9% |
| Median | 2.1% | 3.3% |
| Interquartile 25% (IQ1) | 1.9% | 2.6% |
| Interquartile 75% (IQ3) | 2.5% | 5.4% |
| Interquartile Range (IQR) | 0.58% | 2.9% |
| Standard Deviation (Sample) | 0.54% | 1.9% |
| Standard Deviation (Population) | 0.54% | 1.9% |
Similar Demographics by Self-Care Disability
Demographics Similar to Immigrants from Taiwan by Self-Care Disability
In terms of self-care disability, the demographic groups most similar to Immigrants from Taiwan are Immigrants from Saudi Arabia (2.2%, a difference of 0.25%), Immigrants from Eritrea (2.2%, a difference of 0.33%), Tongan (2.2%, a difference of 0.41%), Immigrants from Kuwait (2.2%, a difference of 0.42%), and Bulgarian (2.2%, a difference of 0.66%).
| Demographics | Rating | Rank | Self-Care Disability |
| Immigrants | South Central Asia | 100.0 /100 | #11 | Exceptional 2.2% |
| Immigrants | Ethiopia | 100.0 /100 | #12 | Exceptional 2.2% |
| Ethiopians | 100.0 /100 | #13 | Exceptional 2.2% |
| Luxembourgers | 100.0 /100 | #14 | Exceptional 2.2% |
| Okinawans | 100.0 /100 | #15 | Exceptional 2.2% |
| Immigrants | Kuwait | 100.0 /100 | #16 | Exceptional 2.2% |
| Immigrants | Saudi Arabia | 100.0 /100 | #17 | Exceptional 2.2% |
| Immigrants | Taiwan | 100.0 /100 | #18 | Exceptional 2.2% |
| Immigrants | Eritrea | 100.0 /100 | #19 | Exceptional 2.2% |
| Tongans | 100.0 /100 | #20 | Exceptional 2.2% |
| Bulgarians | 100.0 /100 | #21 | Exceptional 2.2% |
| Immigrants | Venezuela | 100.0 /100 | #22 | Exceptional 2.2% |
| Cambodians | 100.0 /100 | #23 | Exceptional 2.2% |
| Cypriots | 100.0 /100 | #24 | Exceptional 2.2% |
| Turks | 100.0 /100 | #25 | Exceptional 2.2% |
Demographics Similar to Spaniards by Self-Care Disability
In terms of self-care disability, the demographic groups most similar to Spaniards are French Canadian (2.6%, a difference of 0.0%), Honduran (2.6%, a difference of 0.010%), Subsaharan African (2.6%, a difference of 0.050%), Immigrants from Moldova (2.6%, a difference of 0.060%), and Osage (2.6%, a difference of 0.060%).
| Demographics | Rating | Rank | Self-Care Disability |
| Immigrants | Thailand | 4.5 /100 | #215 | Tragic 2.6% |
| Whites/Caucasians | 4.4 /100 | #216 | Tragic 2.6% |
| Celtics | 4.4 /100 | #217 | Tragic 2.6% |
| Scotch-Irish | 4.1 /100 | #218 | Tragic 2.6% |
| Immigrants | Moldova | 4.0 /100 | #219 | Tragic 2.6% |
| Sub-Saharan Africans | 4.0 /100 | #220 | Tragic 2.6% |
| Hondurans | 3.8 /100 | #221 | Tragic 2.6% |
| Spaniards | 3.8 /100 | #222 | Tragic 2.6% |
| French Canadians | 3.8 /100 | #223 | Tragic 2.6% |
| Osage | 3.6 /100 | #224 | Tragic 2.6% |
| Iraqis | 3.2 /100 | #225 | Tragic 2.6% |
| Chinese | 2.9 /100 | #226 | Tragic 2.6% |
| Immigrants | Philippines | 2.7 /100 | #227 | Tragic 2.6% |
| Guatemalans | 2.7 /100 | #228 | Tragic 2.6% |
| Guamanians/Chamorros | 2.5 /100 | #229 | Tragic 2.6% |