Immigrants from Taiwan vs Delaware In Labor Force | Age 45-54
COMPARE
Immigrants from Taiwan
Delaware
In Labor Force | Age 45-54
In Labor Force | Age 45-54 Comparison
Immigrants from Taiwan
Delaware
83.5%
IN LABOR FORCE | AGE 45-54
98.0/ 100
METRIC RATING
62nd/ 347
METRIC RANK
80.8%
IN LABOR FORCE | AGE 45-54
0.0/ 100
METRIC RATING
285th/ 347
METRIC RANK
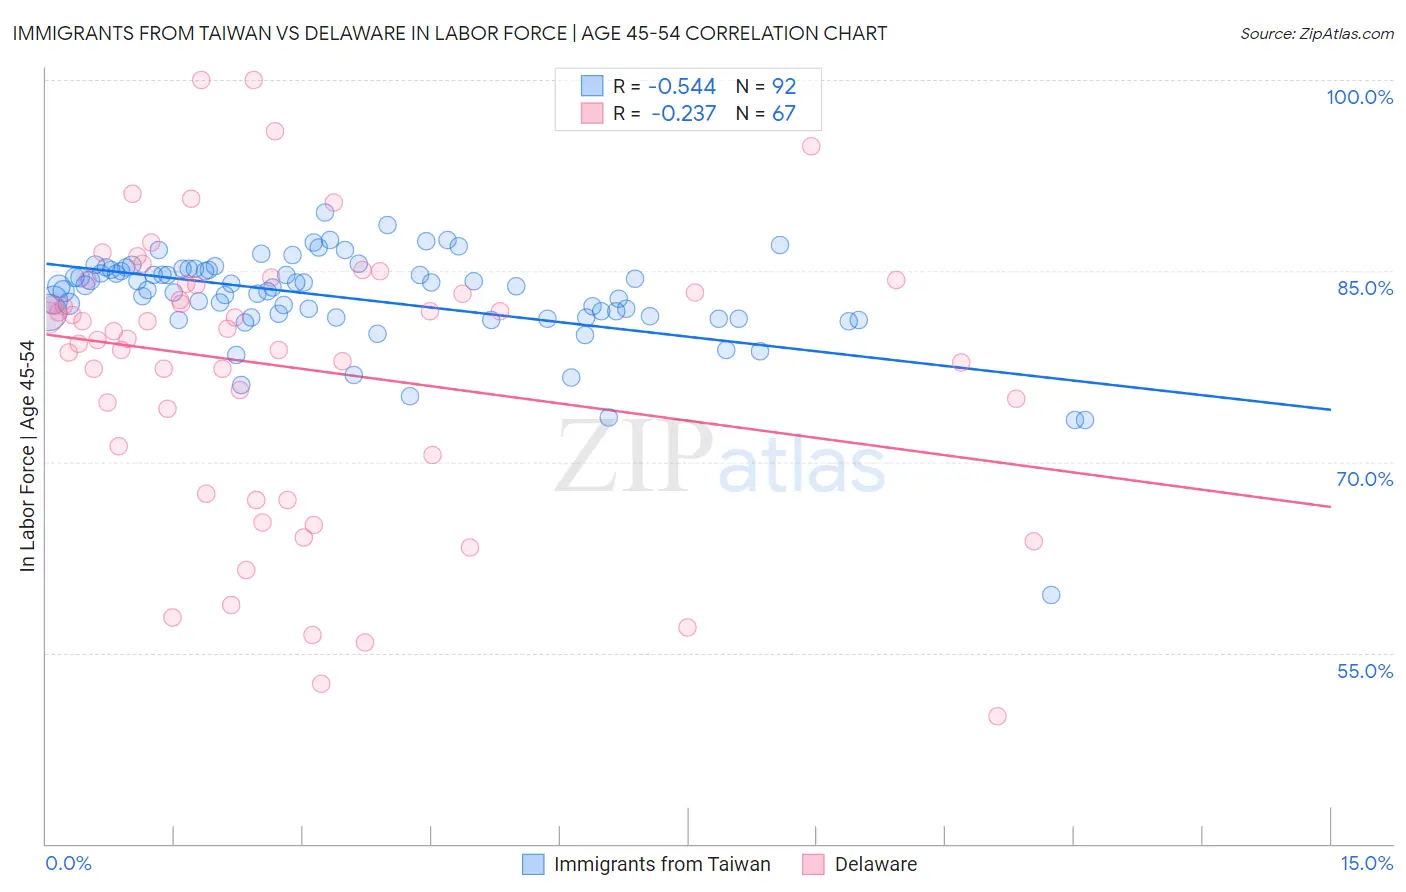
Immigrants from Taiwan vs Delaware In Labor Force | Age 45-54 Correlation Chart
The statistical analysis conducted on geographies consisting of 298,127,806 people shows a substantial negative correlation between the proportion of Immigrants from Taiwan and labor force participation rate among population between the ages 45 and 54 in the United States with a correlation coefficient (R) of -0.544 and weighted average of 83.5%. Similarly, the statistical analysis conducted on geographies consisting of 96,219,228 people shows a weak negative correlation between the proportion of Delaware and labor force participation rate among population between the ages 45 and 54 in the United States with a correlation coefficient (R) of -0.237 and weighted average of 80.8%, a difference of 3.3%.
In Labor Force | Age 45-54 Correlation Summary
| Measurement | Immigrants from Taiwan | Delaware |
| Minimum | 59.5% | 50.0% |
| Maximum | 89.6% | 100.0% |
| Range | 30.1% | 50.0% |
| Mean | 82.8% | 77.4% |
| Median | 83.7% | 80.2% |
| Interquartile 25% (IQ1) | 81.4% | 70.5% |
| Interquartile 75% (IQ3) | 85.1% | 84.0% |
| Interquartile Range (IQR) | 3.7% | 13.5% |
| Standard Deviation (Sample) | 4.0% | 11.1% |
| Standard Deviation (Population) | 4.0% | 11.0% |
Similar Demographics by In Labor Force | Age 45-54
Demographics Similar to Immigrants from Taiwan by In Labor Force | Age 45-54
In terms of in labor force | age 45-54, the demographic groups most similar to Immigrants from Taiwan are Afghan (83.5%, a difference of 0.010%), Immigrants from Kenya (83.5%, a difference of 0.010%), Egyptian (83.5%, a difference of 0.020%), Carpatho Rusyn (83.5%, a difference of 0.030%), and Filipino (83.5%, a difference of 0.030%).
| Demographics | Rating | Rank | In Labor Force | Age 45-54 |
| Macedonians | 98.7 /100 | #55 | Exceptional 83.5% |
| Immigrants | Peru | 98.6 /100 | #56 | Exceptional 83.5% |
| Paraguayans | 98.5 /100 | #57 | Exceptional 83.5% |
| Eastern Europeans | 98.5 /100 | #58 | Exceptional 83.5% |
| Bhutanese | 98.3 /100 | #59 | Exceptional 83.5% |
| Carpatho Rusyns | 98.3 /100 | #60 | Exceptional 83.5% |
| Filipinos | 98.3 /100 | #61 | Exceptional 83.5% |
| Immigrants | Taiwan | 98.0 /100 | #62 | Exceptional 83.5% |
| Afghans | 97.9 /100 | #63 | Exceptional 83.5% |
| Immigrants | Kenya | 97.9 /100 | #64 | Exceptional 83.5% |
| Egyptians | 97.9 /100 | #65 | Exceptional 83.5% |
| Asians | 97.7 /100 | #66 | Exceptional 83.4% |
| Chileans | 97.7 /100 | #67 | Exceptional 83.4% |
| Immigrants | Colombia | 97.6 /100 | #68 | Exceptional 83.4% |
| Taiwanese | 97.5 /100 | #69 | Exceptional 83.4% |
Demographics Similar to Delaware by In Labor Force | Age 45-54
In terms of in labor force | age 45-54, the demographic groups most similar to Delaware are Belizean (80.8%, a difference of 0.010%), Immigrants from Dominica (80.8%, a difference of 0.010%), Vietnamese (80.8%, a difference of 0.010%), Cree (80.8%, a difference of 0.010%), and Immigrants from Bangladesh (80.7%, a difference of 0.040%).
| Demographics | Rating | Rank | In Labor Force | Age 45-54 |
| Immigrants | Guatemala | 0.0 /100 | #278 | Tragic 81.1% |
| Immigrants | Micronesia | 0.0 /100 | #279 | Tragic 81.1% |
| Immigrants | Latin America | 0.0 /100 | #280 | Tragic 81.0% |
| Immigrants | Grenada | 0.0 /100 | #281 | Tragic 81.0% |
| Aleuts | 0.0 /100 | #282 | Tragic 81.0% |
| French American Indians | 0.0 /100 | #283 | Tragic 80.8% |
| Belizeans | 0.0 /100 | #284 | Tragic 80.8% |
| Delaware | 0.0 /100 | #285 | Tragic 80.8% |
| Immigrants | Dominica | 0.0 /100 | #286 | Tragic 80.8% |
| Vietnamese | 0.0 /100 | #287 | Tragic 80.8% |
| Cree | 0.0 /100 | #288 | Tragic 80.8% |
| Immigrants | Bangladesh | 0.0 /100 | #289 | Tragic 80.7% |
| Mexican American Indians | 0.0 /100 | #290 | Tragic 80.7% |
| Immigrants | Belize | 0.0 /100 | #291 | Tragic 80.6% |
| Iroquois | 0.0 /100 | #292 | Tragic 80.6% |