Immigrants from Belarus vs Spaniard In Labor Force | Age 45-54
COMPARE
Immigrants from Belarus
Spaniard
In Labor Force | Age 45-54
In Labor Force | Age 45-54 Comparison
Immigrants from Belarus
Spaniards
83.3%
IN LABOR FORCE | AGE 45-54
94.1/ 100
METRIC RATING
101st/ 347
METRIC RANK
81.5%
IN LABOR FORCE | AGE 45-54
0.1/ 100
METRIC RATING
260th/ 347
METRIC RANK
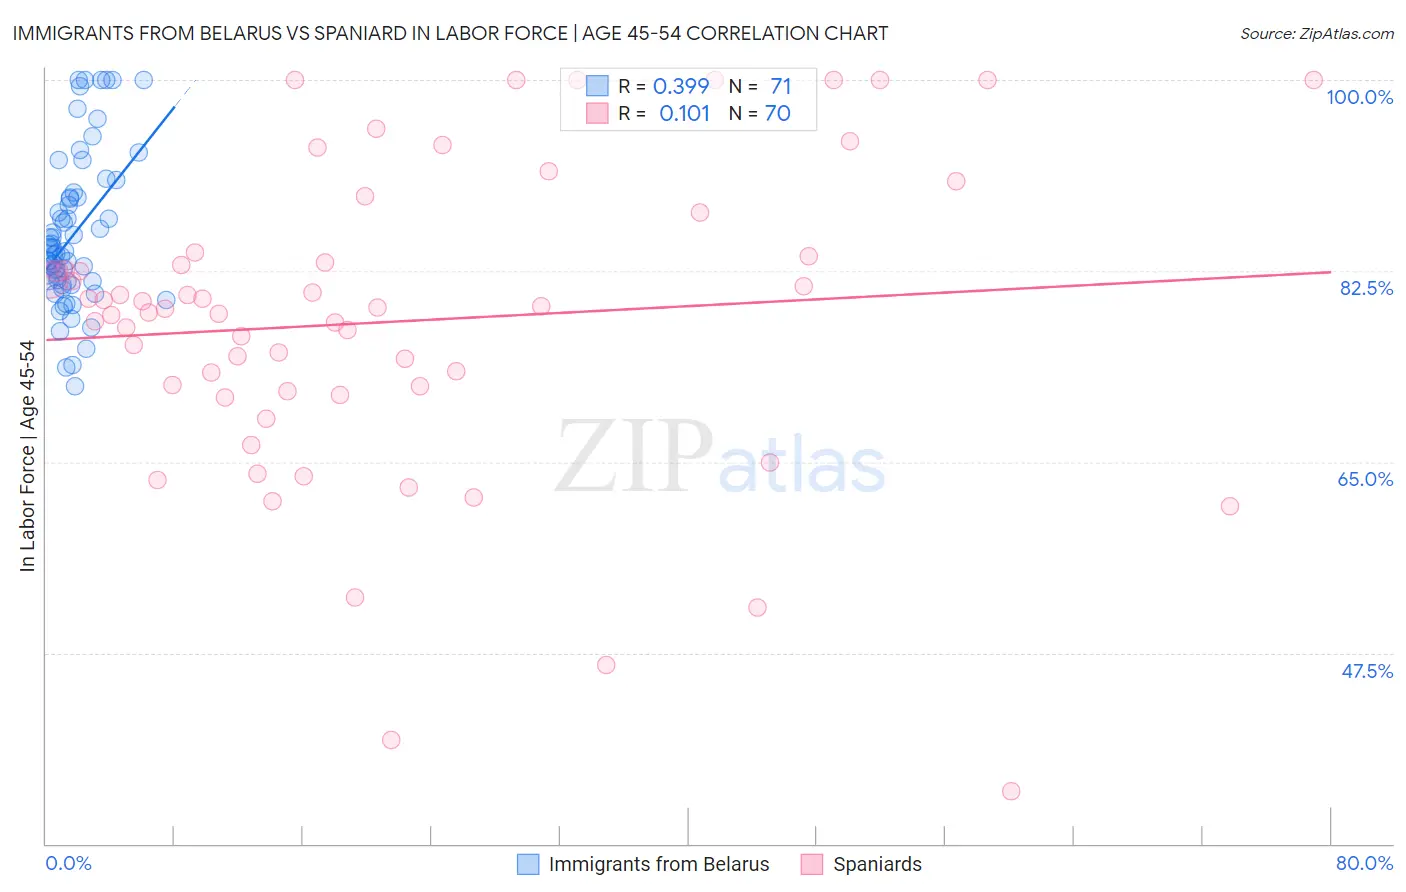
Immigrants from Belarus vs Spaniard In Labor Force | Age 45-54 Correlation Chart
The statistical analysis conducted on geographies consisting of 150,181,664 people shows a mild positive correlation between the proportion of Immigrants from Belarus and labor force participation rate among population between the ages 45 and 54 in the United States with a correlation coefficient (R) of 0.399 and weighted average of 83.3%. Similarly, the statistical analysis conducted on geographies consisting of 443,105,188 people shows a poor positive correlation between the proportion of Spaniards and labor force participation rate among population between the ages 45 and 54 in the United States with a correlation coefficient (R) of 0.101 and weighted average of 81.5%, a difference of 2.1%.
In Labor Force | Age 45-54 Correlation Summary
| Measurement | Immigrants from Belarus | Spaniard |
| Minimum | 71.9% | 34.8% |
| Maximum | 100.0% | 100.0% |
| Range | 28.1% | 65.2% |
| Mean | 85.9% | 77.9% |
| Median | 84.3% | 79.1% |
| Interquartile 25% (IQ1) | 81.5% | 71.5% |
| Interquartile 75% (IQ3) | 89.3% | 83.8% |
| Interquartile Range (IQR) | 7.8% | 12.3% |
| Standard Deviation (Sample) | 6.9% | 14.2% |
| Standard Deviation (Population) | 6.9% | 14.1% |
Similar Demographics by In Labor Force | Age 45-54
Demographics Similar to Immigrants from Belarus by In Labor Force | Age 45-54
In terms of in labor force | age 45-54, the demographic groups most similar to Immigrants from Belarus are Mongolian (83.3%, a difference of 0.0%), Maltese (83.3%, a difference of 0.010%), Immigrants from Middle Africa (83.3%, a difference of 0.010%), Immigrants from Singapore (83.3%, a difference of 0.010%), and Albanian (83.3%, a difference of 0.010%).
| Demographics | Rating | Rank | In Labor Force | Age 45-54 |
| Argentineans | 94.9 /100 | #94 | Exceptional 83.3% |
| Immigrants | Argentina | 94.9 /100 | #95 | Exceptional 83.3% |
| Immigrants | Kuwait | 94.8 /100 | #96 | Exceptional 83.3% |
| Palestinians | 94.8 /100 | #97 | Exceptional 83.3% |
| Maltese | 94.4 /100 | #98 | Exceptional 83.3% |
| Immigrants | Middle Africa | 94.3 /100 | #99 | Exceptional 83.3% |
| Mongolians | 94.2 /100 | #100 | Exceptional 83.3% |
| Immigrants | Belarus | 94.1 /100 | #101 | Exceptional 83.3% |
| Immigrants | Singapore | 93.9 /100 | #102 | Exceptional 83.3% |
| Albanians | 93.9 /100 | #103 | Exceptional 83.3% |
| Immigrants | Romania | 93.8 /100 | #104 | Exceptional 83.3% |
| Immigrants | South America | 93.5 /100 | #105 | Exceptional 83.2% |
| Sri Lankans | 93.2 /100 | #106 | Exceptional 83.2% |
| Iranians | 92.9 /100 | #107 | Exceptional 83.2% |
| Slovaks | 92.8 /100 | #108 | Exceptional 83.2% |
Demographics Similar to Spaniards by In Labor Force | Age 45-54
In terms of in labor force | age 45-54, the demographic groups most similar to Spaniards are Hawaiian (81.5%, a difference of 0.020%), Immigrants from Guyana (81.5%, a difference of 0.020%), Immigrants from Fiji (81.5%, a difference of 0.030%), Guyanese (81.5%, a difference of 0.030%), and Indonesian (81.5%, a difference of 0.030%).
| Demographics | Rating | Rank | In Labor Force | Age 45-54 |
| Japanese | 0.2 /100 | #253 | Tragic 81.6% |
| Immigrants | Laos | 0.2 /100 | #254 | Tragic 81.6% |
| Scotch-Irish | 0.2 /100 | #255 | Tragic 81.6% |
| Barbadians | 0.1 /100 | #256 | Tragic 81.6% |
| Immigrants | Congo | 0.1 /100 | #257 | Tragic 81.6% |
| Immigrants | Fiji | 0.1 /100 | #258 | Tragic 81.5% |
| Guyanese | 0.1 /100 | #259 | Tragic 81.5% |
| Spaniards | 0.1 /100 | #260 | Tragic 81.5% |
| Hawaiians | 0.1 /100 | #261 | Tragic 81.5% |
| Immigrants | Guyana | 0.1 /100 | #262 | Tragic 81.5% |
| Indonesians | 0.1 /100 | #263 | Tragic 81.5% |
| Immigrants | West Indies | 0.1 /100 | #264 | Tragic 81.5% |
| Hondurans | 0.1 /100 | #265 | Tragic 81.4% |
| Immigrants | St. Vincent and the Grenadines | 0.1 /100 | #266 | Tragic 81.4% |
| West Indians | 0.1 /100 | #267 | Tragic 81.4% |