Immigrants from Israel vs Spaniard In Labor Force | Age 45-54
COMPARE
Immigrants from Israel
Spaniard
In Labor Force | Age 45-54
In Labor Force | Age 45-54 Comparison
Immigrants from Israel
Spaniards
83.1%
IN LABOR FORCE | AGE 45-54
84.7/ 100
METRIC RATING
130th/ 347
METRIC RANK
81.5%
IN LABOR FORCE | AGE 45-54
0.1/ 100
METRIC RATING
260th/ 347
METRIC RANK
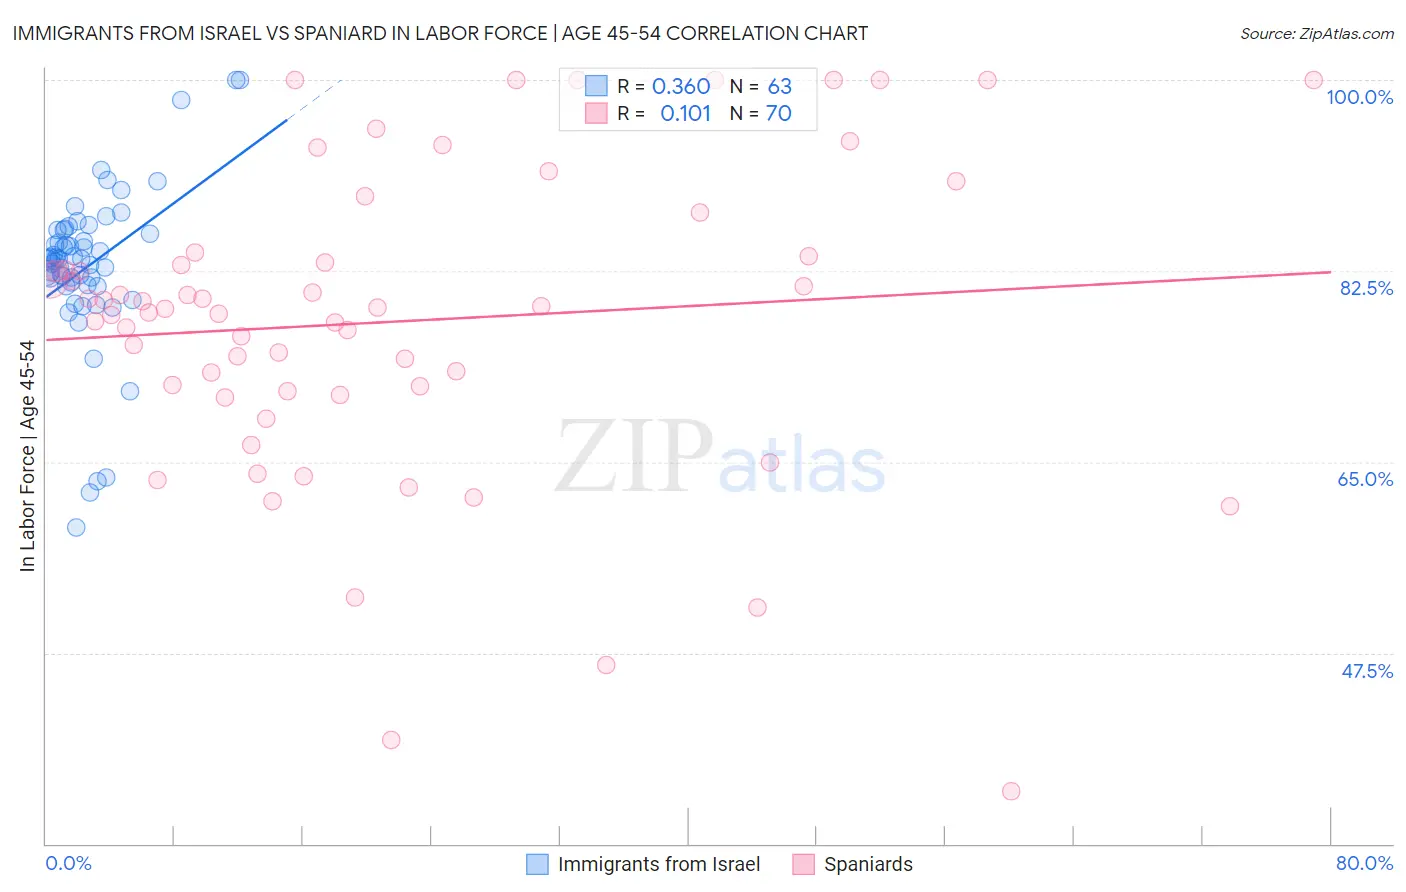
Immigrants from Israel vs Spaniard In Labor Force | Age 45-54 Correlation Chart
The statistical analysis conducted on geographies consisting of 209,979,344 people shows a mild positive correlation between the proportion of Immigrants from Israel and labor force participation rate among population between the ages 45 and 54 in the United States with a correlation coefficient (R) of 0.360 and weighted average of 83.1%. Similarly, the statistical analysis conducted on geographies consisting of 443,105,188 people shows a poor positive correlation between the proportion of Spaniards and labor force participation rate among population between the ages 45 and 54 in the United States with a correlation coefficient (R) of 0.101 and weighted average of 81.5%, a difference of 1.9%.
In Labor Force | Age 45-54 Correlation Summary
| Measurement | Immigrants from Israel | Spaniard |
| Minimum | 59.0% | 34.8% |
| Maximum | 100.0% | 100.0% |
| Range | 41.0% | 65.2% |
| Mean | 82.9% | 77.9% |
| Median | 83.6% | 79.1% |
| Interquartile 25% (IQ1) | 81.2% | 71.5% |
| Interquartile 75% (IQ3) | 86.2% | 83.8% |
| Interquartile Range (IQR) | 5.0% | 12.3% |
| Standard Deviation (Sample) | 7.4% | 14.2% |
| Standard Deviation (Population) | 7.3% | 14.1% |
Similar Demographics by In Labor Force | Age 45-54
Demographics Similar to Immigrants from Israel by In Labor Force | Age 45-54
In terms of in labor force | age 45-54, the demographic groups most similar to Immigrants from Israel are Immigrants from Jordan (83.1%, a difference of 0.010%), German (83.1%, a difference of 0.010%), Immigrants from Northern Europe (83.1%, a difference of 0.010%), Finnish (83.1%, a difference of 0.020%), and Immigrants from Belgium (83.1%, a difference of 0.030%).
| Demographics | Rating | Rank | In Labor Force | Age 45-54 |
| Tongans | 88.2 /100 | #123 | Excellent 83.1% |
| Bermudans | 88.0 /100 | #124 | Excellent 83.1% |
| Immigrants | Iran | 87.2 /100 | #125 | Excellent 83.1% |
| Immigrants | Belgium | 86.4 /100 | #126 | Excellent 83.1% |
| Immigrants | Jordan | 85.2 /100 | #127 | Excellent 83.1% |
| Germans | 85.1 /100 | #128 | Excellent 83.1% |
| Immigrants | Northern Europe | 85.1 /100 | #129 | Excellent 83.1% |
| Immigrants | Israel | 84.7 /100 | #130 | Excellent 83.1% |
| Finns | 83.3 /100 | #131 | Excellent 83.1% |
| Immigrants | Ukraine | 82.9 /100 | #132 | Excellent 83.0% |
| Liberians | 82.7 /100 | #133 | Excellent 83.0% |
| Sudanese | 82.0 /100 | #134 | Excellent 83.0% |
| Austrians | 81.3 /100 | #135 | Excellent 83.0% |
| Immigrants | Kazakhstan | 81.0 /100 | #136 | Excellent 83.0% |
| Immigrants | Spain | 80.4 /100 | #137 | Excellent 83.0% |
Demographics Similar to Spaniards by In Labor Force | Age 45-54
In terms of in labor force | age 45-54, the demographic groups most similar to Spaniards are Hawaiian (81.5%, a difference of 0.020%), Immigrants from Guyana (81.5%, a difference of 0.020%), Immigrants from Fiji (81.5%, a difference of 0.030%), Guyanese (81.5%, a difference of 0.030%), and Indonesian (81.5%, a difference of 0.030%).
| Demographics | Rating | Rank | In Labor Force | Age 45-54 |
| Japanese | 0.2 /100 | #253 | Tragic 81.6% |
| Immigrants | Laos | 0.2 /100 | #254 | Tragic 81.6% |
| Scotch-Irish | 0.2 /100 | #255 | Tragic 81.6% |
| Barbadians | 0.1 /100 | #256 | Tragic 81.6% |
| Immigrants | Congo | 0.1 /100 | #257 | Tragic 81.6% |
| Immigrants | Fiji | 0.1 /100 | #258 | Tragic 81.5% |
| Guyanese | 0.1 /100 | #259 | Tragic 81.5% |
| Spaniards | 0.1 /100 | #260 | Tragic 81.5% |
| Hawaiians | 0.1 /100 | #261 | Tragic 81.5% |
| Immigrants | Guyana | 0.1 /100 | #262 | Tragic 81.5% |
| Indonesians | 0.1 /100 | #263 | Tragic 81.5% |
| Immigrants | West Indies | 0.1 /100 | #264 | Tragic 81.5% |
| Hondurans | 0.1 /100 | #265 | Tragic 81.4% |
| Immigrants | St. Vincent and the Grenadines | 0.1 /100 | #266 | Tragic 81.4% |
| West Indians | 0.1 /100 | #267 | Tragic 81.4% |