Immigrants from Taiwan vs Ethiopian In Labor Force | Age 45-54
COMPARE
Immigrants from Taiwan
Ethiopian
In Labor Force | Age 45-54
In Labor Force | Age 45-54 Comparison
Immigrants from Taiwan
Ethiopians
83.5%
IN LABOR FORCE | AGE 45-54
98.0/ 100
METRIC RATING
62nd/ 347
METRIC RANK
84.8%
IN LABOR FORCE | AGE 45-54
100.0/ 100
METRIC RATING
5th/ 347
METRIC RANK
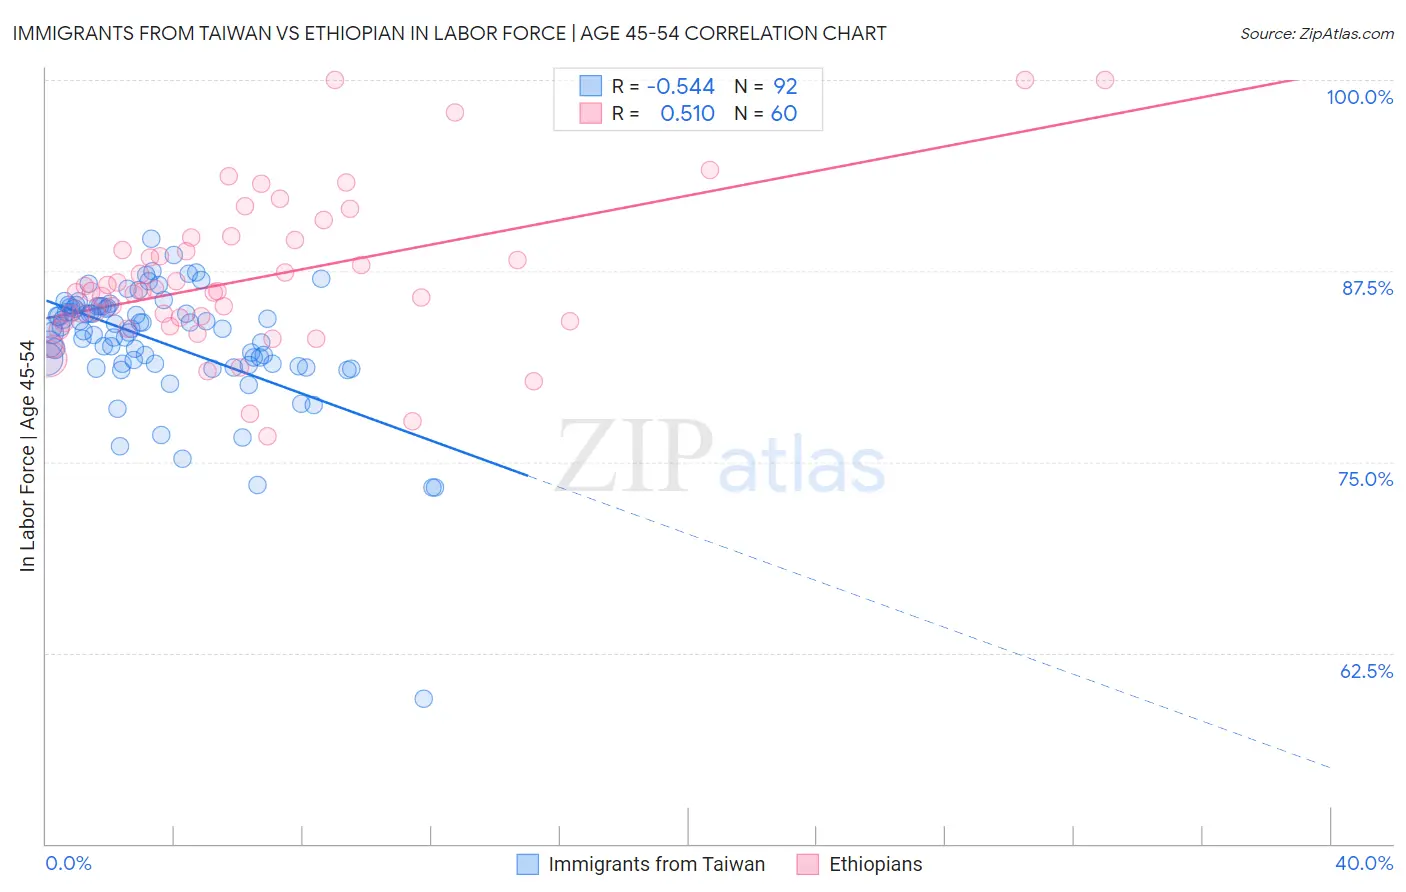
Immigrants from Taiwan vs Ethiopian In Labor Force | Age 45-54 Correlation Chart
The statistical analysis conducted on geographies consisting of 298,127,806 people shows a substantial negative correlation between the proportion of Immigrants from Taiwan and labor force participation rate among population between the ages 45 and 54 in the United States with a correlation coefficient (R) of -0.544 and weighted average of 83.5%. Similarly, the statistical analysis conducted on geographies consisting of 223,081,675 people shows a substantial positive correlation between the proportion of Ethiopians and labor force participation rate among population between the ages 45 and 54 in the United States with a correlation coefficient (R) of 0.510 and weighted average of 84.8%, a difference of 1.5%.
In Labor Force | Age 45-54 Correlation Summary
| Measurement | Immigrants from Taiwan | Ethiopian |
| Minimum | 59.5% | 76.7% |
| Maximum | 89.6% | 100.0% |
| Range | 30.1% | 23.3% |
| Mean | 82.8% | 87.0% |
| Median | 83.7% | 86.1% |
| Interquartile 25% (IQ1) | 81.4% | 84.2% |
| Interquartile 75% (IQ3) | 85.1% | 89.2% |
| Interquartile Range (IQR) | 3.7% | 5.0% |
| Standard Deviation (Sample) | 4.0% | 5.0% |
| Standard Deviation (Population) | 4.0% | 5.0% |
Similar Demographics by In Labor Force | Age 45-54
Demographics Similar to Immigrants from Taiwan by In Labor Force | Age 45-54
In terms of in labor force | age 45-54, the demographic groups most similar to Immigrants from Taiwan are Afghan (83.5%, a difference of 0.010%), Immigrants from Kenya (83.5%, a difference of 0.010%), Egyptian (83.5%, a difference of 0.020%), Carpatho Rusyn (83.5%, a difference of 0.030%), and Filipino (83.5%, a difference of 0.030%).
| Demographics | Rating | Rank | In Labor Force | Age 45-54 |
| Macedonians | 98.7 /100 | #55 | Exceptional 83.5% |
| Immigrants | Peru | 98.6 /100 | #56 | Exceptional 83.5% |
| Paraguayans | 98.5 /100 | #57 | Exceptional 83.5% |
| Eastern Europeans | 98.5 /100 | #58 | Exceptional 83.5% |
| Bhutanese | 98.3 /100 | #59 | Exceptional 83.5% |
| Carpatho Rusyns | 98.3 /100 | #60 | Exceptional 83.5% |
| Filipinos | 98.3 /100 | #61 | Exceptional 83.5% |
| Immigrants | Taiwan | 98.0 /100 | #62 | Exceptional 83.5% |
| Afghans | 97.9 /100 | #63 | Exceptional 83.5% |
| Immigrants | Kenya | 97.9 /100 | #64 | Exceptional 83.5% |
| Egyptians | 97.9 /100 | #65 | Exceptional 83.5% |
| Asians | 97.7 /100 | #66 | Exceptional 83.4% |
| Chileans | 97.7 /100 | #67 | Exceptional 83.4% |
| Immigrants | Colombia | 97.6 /100 | #68 | Exceptional 83.4% |
| Taiwanese | 97.5 /100 | #69 | Exceptional 83.4% |
Demographics Similar to Ethiopians by In Labor Force | Age 45-54
In terms of in labor force | age 45-54, the demographic groups most similar to Ethiopians are Immigrants from Ethiopia (84.8%, a difference of 0.080%), Immigrants from India (84.7%, a difference of 0.11%), Immigrants from Cameroon (84.6%, a difference of 0.18%), Bolivian (84.9%, a difference of 0.20%), and Luxembourger (85.0%, a difference of 0.29%).
| Demographics | Rating | Rank | In Labor Force | Age 45-54 |
| Immigrants | Bolivia | 100.0 /100 | #1 | Exceptional 85.3% |
| Luxembourgers | 100.0 /100 | #2 | Exceptional 85.0% |
| Bolivians | 100.0 /100 | #3 | Exceptional 84.9% |
| Immigrants | Ethiopia | 100.0 /100 | #4 | Exceptional 84.8% |
| Ethiopians | 100.0 /100 | #5 | Exceptional 84.8% |
| Immigrants | India | 100.0 /100 | #6 | Exceptional 84.7% |
| Immigrants | Cameroon | 100.0 /100 | #7 | Exceptional 84.6% |
| Sierra Leoneans | 100.0 /100 | #8 | Exceptional 84.5% |
| Immigrants | Sierra Leone | 100.0 /100 | #9 | Exceptional 84.4% |
| Norwegians | 100.0 /100 | #10 | Exceptional 84.4% |
| Thais | 100.0 /100 | #11 | Exceptional 84.3% |
| Bulgarians | 100.0 /100 | #12 | Exceptional 84.2% |
| Chinese | 99.9 /100 | #13 | Exceptional 84.1% |
| Cambodians | 99.9 /100 | #14 | Exceptional 84.1% |
| Cypriots | 99.9 /100 | #15 | Exceptional 84.1% |