Immigrants from Taiwan vs Laotian In Labor Force | Age 45-54
COMPARE
Immigrants from Taiwan
Laotian
In Labor Force | Age 45-54
In Labor Force | Age 45-54 Comparison
Immigrants from Taiwan
Laotians
83.5%
IN LABOR FORCE | AGE 45-54
98.0/ 100
METRIC RATING
62nd/ 347
METRIC RANK
82.9%
IN LABOR FORCE | AGE 45-54
62.8/ 100
METRIC RATING
160th/ 347
METRIC RANK
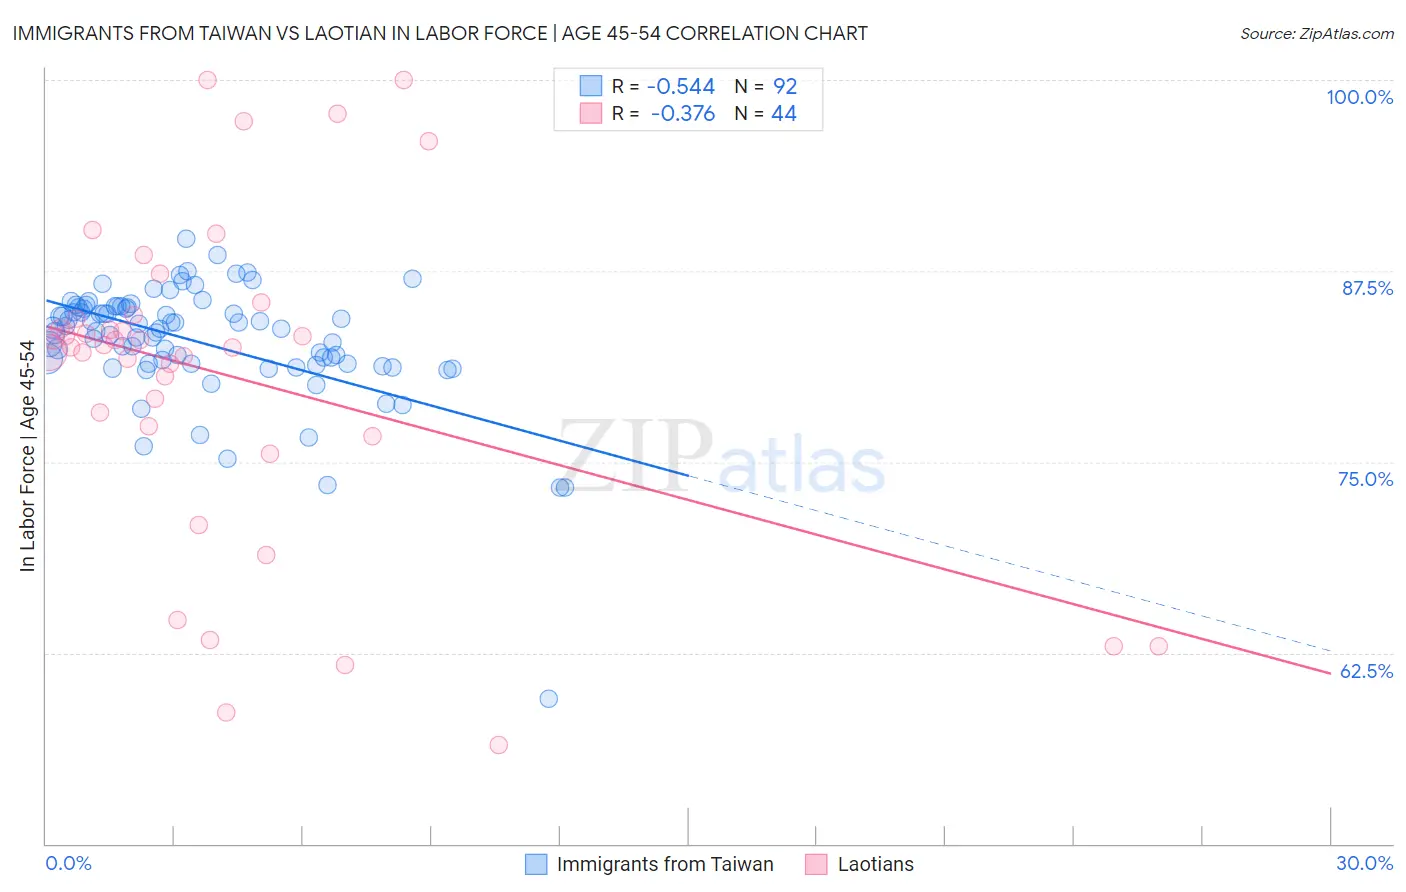
Immigrants from Taiwan vs Laotian In Labor Force | Age 45-54 Correlation Chart
The statistical analysis conducted on geographies consisting of 298,127,806 people shows a substantial negative correlation between the proportion of Immigrants from Taiwan and labor force participation rate among population between the ages 45 and 54 in the United States with a correlation coefficient (R) of -0.544 and weighted average of 83.5%. Similarly, the statistical analysis conducted on geographies consisting of 224,742,074 people shows a mild negative correlation between the proportion of Laotians and labor force participation rate among population between the ages 45 and 54 in the United States with a correlation coefficient (R) of -0.376 and weighted average of 82.9%, a difference of 0.74%.
In Labor Force | Age 45-54 Correlation Summary
| Measurement | Immigrants from Taiwan | Laotian |
| Minimum | 59.5% | 56.5% |
| Maximum | 89.6% | 100.0% |
| Range | 30.1% | 43.5% |
| Mean | 82.8% | 80.6% |
| Median | 83.7% | 82.6% |
| Interquartile 25% (IQ1) | 81.4% | 77.0% |
| Interquartile 75% (IQ3) | 85.1% | 84.5% |
| Interquartile Range (IQR) | 3.7% | 7.5% |
| Standard Deviation (Sample) | 4.0% | 10.7% |
| Standard Deviation (Population) | 4.0% | 10.5% |
Similar Demographics by In Labor Force | Age 45-54
Demographics Similar to Immigrants from Taiwan by In Labor Force | Age 45-54
In terms of in labor force | age 45-54, the demographic groups most similar to Immigrants from Taiwan are Afghan (83.5%, a difference of 0.010%), Immigrants from Kenya (83.5%, a difference of 0.010%), Egyptian (83.5%, a difference of 0.020%), Carpatho Rusyn (83.5%, a difference of 0.030%), and Filipino (83.5%, a difference of 0.030%).
| Demographics | Rating | Rank | In Labor Force | Age 45-54 |
| Macedonians | 98.7 /100 | #55 | Exceptional 83.5% |
| Immigrants | Peru | 98.6 /100 | #56 | Exceptional 83.5% |
| Paraguayans | 98.5 /100 | #57 | Exceptional 83.5% |
| Eastern Europeans | 98.5 /100 | #58 | Exceptional 83.5% |
| Bhutanese | 98.3 /100 | #59 | Exceptional 83.5% |
| Carpatho Rusyns | 98.3 /100 | #60 | Exceptional 83.5% |
| Filipinos | 98.3 /100 | #61 | Exceptional 83.5% |
| Immigrants | Taiwan | 98.0 /100 | #62 | Exceptional 83.5% |
| Afghans | 97.9 /100 | #63 | Exceptional 83.5% |
| Immigrants | Kenya | 97.9 /100 | #64 | Exceptional 83.5% |
| Egyptians | 97.9 /100 | #65 | Exceptional 83.5% |
| Asians | 97.7 /100 | #66 | Exceptional 83.4% |
| Chileans | 97.7 /100 | #67 | Exceptional 83.4% |
| Immigrants | Colombia | 97.6 /100 | #68 | Exceptional 83.4% |
| Taiwanese | 97.5 /100 | #69 | Exceptional 83.4% |
Demographics Similar to Laotians by In Labor Force | Age 45-54
In terms of in labor force | age 45-54, the demographic groups most similar to Laotians are South American Indian (82.9%, a difference of 0.010%), Haitian (82.8%, a difference of 0.010%), Dutch (82.8%, a difference of 0.010%), German Russian (82.8%, a difference of 0.010%), and Immigrants from Austria (82.9%, a difference of 0.020%).
| Demographics | Rating | Rank | In Labor Force | Age 45-54 |
| Immigrants | Indonesia | 70.6 /100 | #153 | Good 82.9% |
| Immigrants | Ghana | 70.3 /100 | #154 | Good 82.9% |
| Immigrants | Philippines | 69.0 /100 | #155 | Good 82.9% |
| Immigrants | Saudi Arabia | 68.8 /100 | #156 | Good 82.9% |
| Immigrants | Australia | 68.2 /100 | #157 | Good 82.9% |
| Immigrants | Southern Europe | 67.8 /100 | #158 | Good 82.9% |
| Immigrants | Austria | 64.6 /100 | #159 | Good 82.9% |
| Laotians | 62.8 /100 | #160 | Good 82.9% |
| South American Indians | 62.2 /100 | #161 | Good 82.9% |
| Haitians | 61.8 /100 | #162 | Good 82.8% |
| Dutch | 61.7 /100 | #163 | Good 82.8% |
| German Russians | 61.3 /100 | #164 | Good 82.8% |
| Immigrants | Sudan | 59.9 /100 | #165 | Average 82.8% |
| Immigrants | South Eastern Asia | 57.4 /100 | #166 | Average 82.8% |
| Swiss | 56.5 /100 | #167 | Average 82.8% |