Immigrants from Israel vs Lebanese In Labor Force | Age > 16
COMPARE
Immigrants from Israel
Lebanese
In Labor Force | Age > 16
In Labor Force | Age > 16 Comparison
Immigrants from Israel
Lebanese
65.2%
IN LABOR FORCE | AGE > 16
61.7/ 100
METRIC RATING
170th/ 347
METRIC RANK
64.5%
IN LABOR FORCE | AGE > 16
3.9/ 100
METRIC RATING
238th/ 347
METRIC RANK
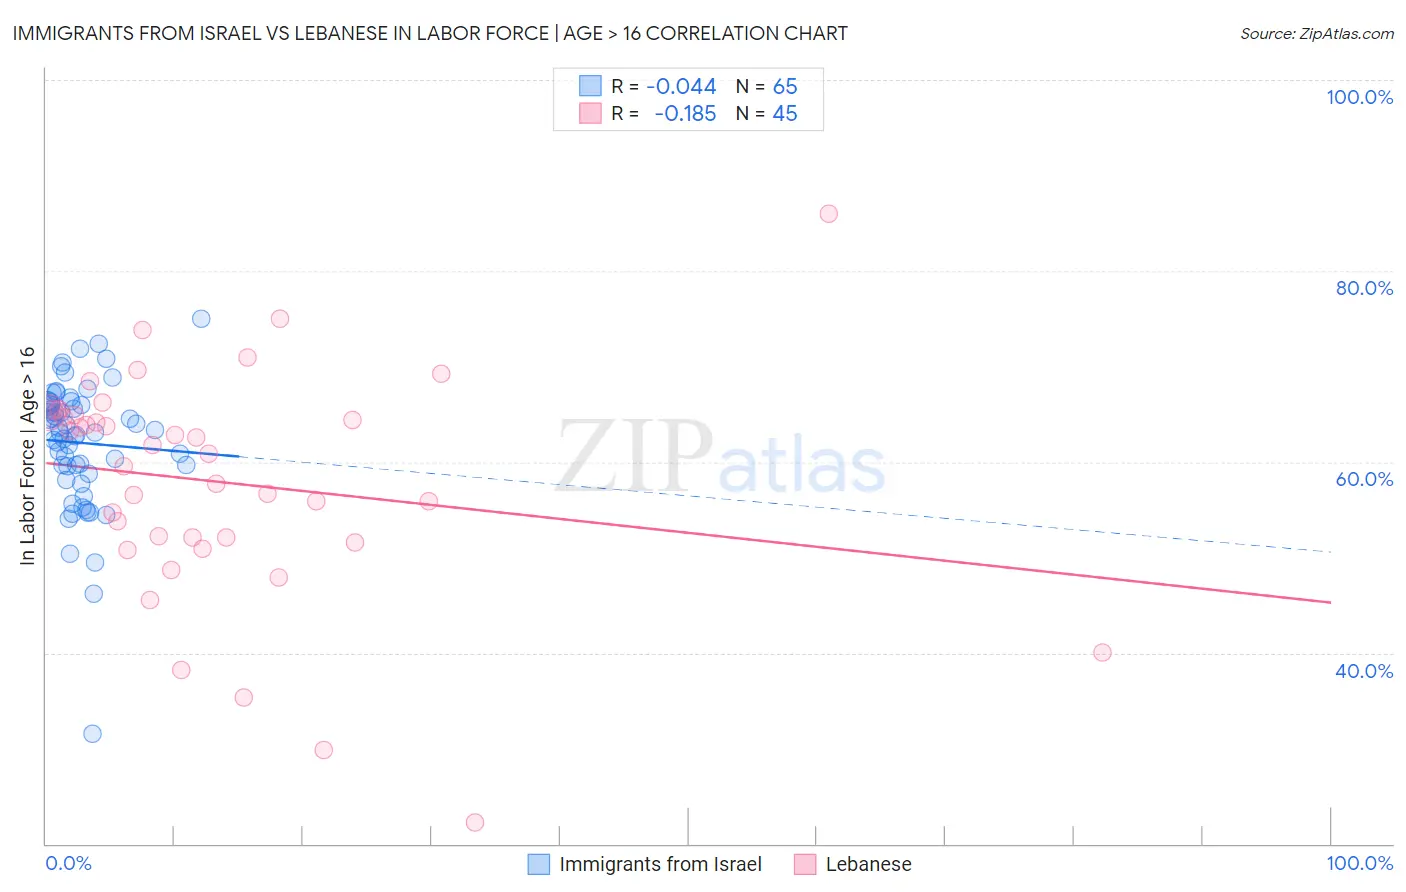
Immigrants from Israel vs Lebanese In Labor Force | Age > 16 Correlation Chart
The statistical analysis conducted on geographies consisting of 210,034,419 people shows no correlation between the proportion of Immigrants from Israel and labor force participation rate among population ages 16 and over in the United States with a correlation coefficient (R) of -0.044 and weighted average of 65.2%. Similarly, the statistical analysis conducted on geographies consisting of 401,629,363 people shows a poor negative correlation between the proportion of Lebanese and labor force participation rate among population ages 16 and over in the United States with a correlation coefficient (R) of -0.185 and weighted average of 64.5%, a difference of 1.0%.
In Labor Force | Age > 16 Correlation Summary
| Measurement | Immigrants from Israel | Lebanese |
| Minimum | 31.5% | 22.2% |
| Maximum | 75.0% | 86.0% |
| Range | 43.5% | 63.8% |
| Mean | 62.0% | 57.9% |
| Median | 63.1% | 60.9% |
| Interquartile 25% (IQ1) | 59.2% | 51.8% |
| Interquartile 75% (IQ3) | 66.1% | 65.0% |
| Interquartile Range (IQR) | 7.0% | 13.2% |
| Standard Deviation (Sample) | 6.9% | 12.1% |
| Standard Deviation (Population) | 6.8% | 11.9% |
Similar Demographics by In Labor Force | Age > 16
Demographics Similar to Immigrants from Israel by In Labor Force | Age > 16
In terms of in labor force | age > 16, the demographic groups most similar to Immigrants from Israel are Israeli (65.2%, a difference of 0.0%), Immigrants from Sweden (65.2%, a difference of 0.0%), Arab (65.2%, a difference of 0.010%), Serbian (65.2%, a difference of 0.020%), and Immigrants from Belarus (65.2%, a difference of 0.050%).
| Demographics | Rating | Rank | In Labor Force | Age > 16 |
| South Africans | 69.8 /100 | #163 | Good 65.3% |
| Danes | 68.8 /100 | #164 | Good 65.3% |
| Immigrants | Kazakhstan | 68.1 /100 | #165 | Good 65.3% |
| Immigrants | Western Asia | 67.3 /100 | #166 | Good 65.3% |
| Immigrants | Belarus | 66.0 /100 | #167 | Good 65.2% |
| Serbians | 63.5 /100 | #168 | Good 65.2% |
| Arabs | 62.4 /100 | #169 | Good 65.2% |
| Immigrants | Israel | 61.7 /100 | #170 | Good 65.2% |
| Israelis | 61.6 /100 | #171 | Good 65.2% |
| Immigrants | Sweden | 61.3 /100 | #172 | Good 65.2% |
| Immigrants | Ukraine | 53.7 /100 | #173 | Average 65.1% |
| Macedonians | 50.0 /100 | #174 | Average 65.1% |
| Nicaraguans | 49.7 /100 | #175 | Average 65.1% |
| Swedes | 47.4 /100 | #176 | Average 65.1% |
| Eastern Europeans | 46.2 /100 | #177 | Average 65.1% |
Demographics Similar to Lebanese by In Labor Force | Age > 16
In terms of in labor force | age > 16, the demographic groups most similar to Lebanese are Immigrants from Hungary (64.5%, a difference of 0.010%), Immigrants from Bangladesh (64.5%, a difference of 0.030%), Immigrants from Dominica (64.5%, a difference of 0.030%), Immigrants from Netherlands (64.5%, a difference of 0.040%), and Vietnamese (64.6%, a difference of 0.050%).
| Demographics | Rating | Rank | In Labor Force | Age > 16 |
| Immigrants | Northern Europe | 7.2 /100 | #231 | Tragic 64.7% |
| Africans | 5.8 /100 | #232 | Tragic 64.6% |
| Slavs | 4.9 /100 | #233 | Tragic 64.6% |
| Vietnamese | 4.7 /100 | #234 | Tragic 64.6% |
| Austrians | 4.6 /100 | #235 | Tragic 64.6% |
| Immigrants | Norway | 4.6 /100 | #236 | Tragic 64.6% |
| Italians | 4.6 /100 | #237 | Tragic 64.6% |
| Lebanese | 3.9 /100 | #238 | Tragic 64.5% |
| Immigrants | Hungary | 3.8 /100 | #239 | Tragic 64.5% |
| Immigrants | Bangladesh | 3.6 /100 | #240 | Tragic 64.5% |
| Immigrants | Dominica | 3.5 /100 | #241 | Tragic 64.5% |
| Immigrants | Netherlands | 3.4 /100 | #242 | Tragic 64.5% |
| Immigrants | Lebanon | 3.2 /100 | #243 | Tragic 64.5% |
| Tsimshian | 3.1 /100 | #244 | Tragic 64.5% |
| West Indians | 3.0 /100 | #245 | Tragic 64.5% |