Senegalese vs Lebanese In Labor Force | Age > 16
COMPARE
Senegalese
Lebanese
In Labor Force | Age > 16
In Labor Force | Age > 16 Comparison
Senegalese
Lebanese
66.7%
IN LABOR FORCE | AGE > 16
100.0/ 100
METRIC RATING
42nd/ 347
METRIC RANK
64.5%
IN LABOR FORCE | AGE > 16
3.9/ 100
METRIC RATING
238th/ 347
METRIC RANK
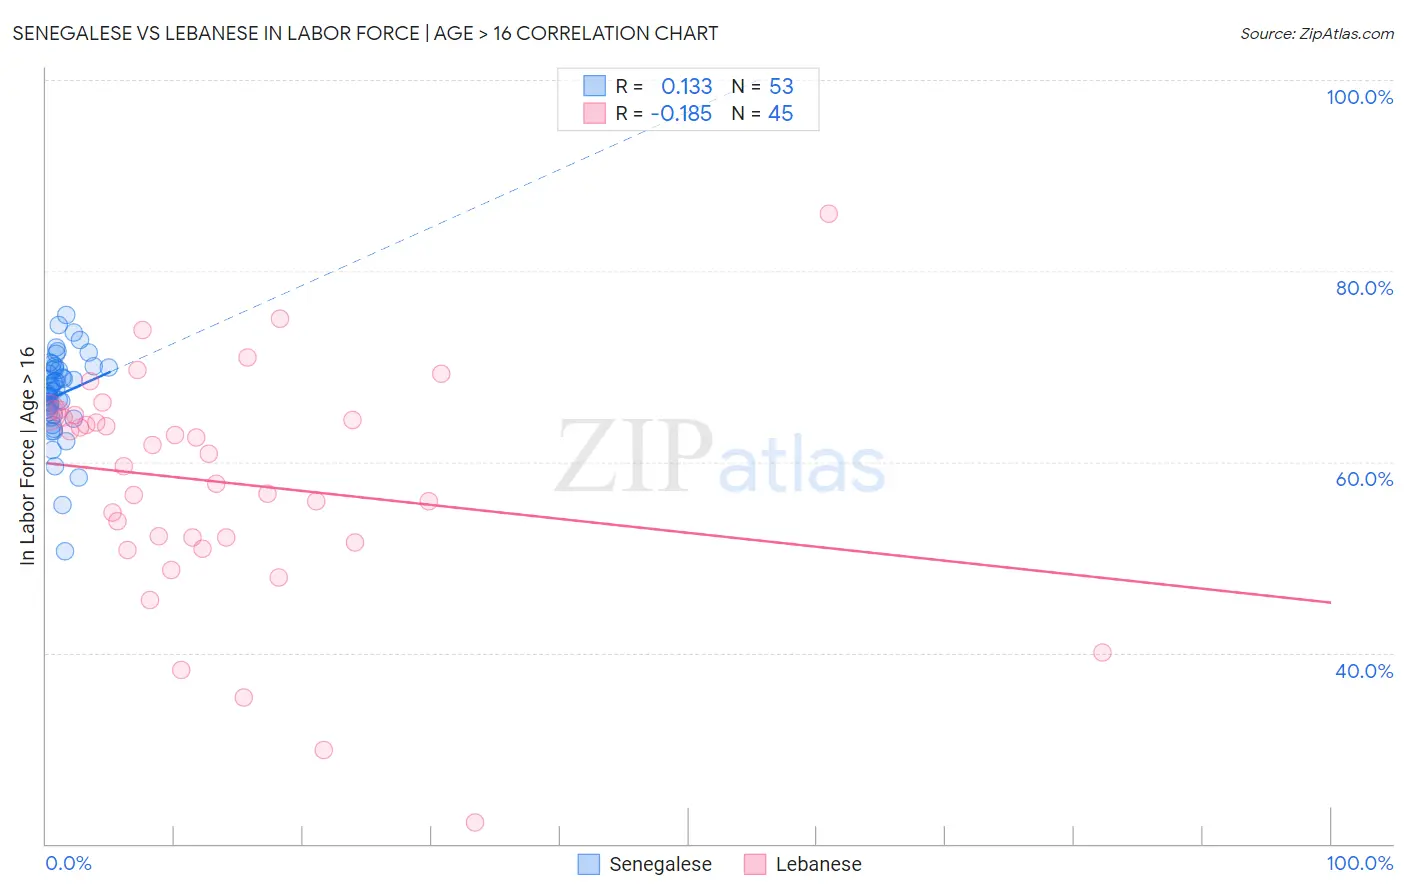
Senegalese vs Lebanese In Labor Force | Age > 16 Correlation Chart
The statistical analysis conducted on geographies consisting of 78,141,567 people shows a poor positive correlation between the proportion of Senegalese and labor force participation rate among population ages 16 and over in the United States with a correlation coefficient (R) of 0.133 and weighted average of 66.7%. Similarly, the statistical analysis conducted on geographies consisting of 401,629,363 people shows a poor negative correlation between the proportion of Lebanese and labor force participation rate among population ages 16 and over in the United States with a correlation coefficient (R) of -0.185 and weighted average of 64.5%, a difference of 3.4%.
In Labor Force | Age > 16 Correlation Summary
| Measurement | Senegalese | Lebanese |
| Minimum | 50.6% | 22.2% |
| Maximum | 75.4% | 86.0% |
| Range | 24.8% | 63.8% |
| Mean | 67.0% | 57.9% |
| Median | 67.5% | 60.9% |
| Interquartile 25% (IQ1) | 65.0% | 51.8% |
| Interquartile 75% (IQ3) | 69.8% | 65.0% |
| Interquartile Range (IQR) | 4.8% | 13.2% |
| Standard Deviation (Sample) | 4.5% | 12.1% |
| Standard Deviation (Population) | 4.4% | 11.9% |
Similar Demographics by In Labor Force | Age > 16
Demographics Similar to Senegalese by In Labor Force | Age > 16
In terms of in labor force | age > 16, the demographic groups most similar to Senegalese are Luxembourger (66.7%, a difference of 0.020%), Immigrants from Pakistan (66.7%, a difference of 0.070%), Immigrants from El Salvador (66.8%, a difference of 0.10%), Immigrants from Zimbabwe (66.8%, a difference of 0.10%), and Salvadoran (66.8%, a difference of 0.11%).
| Demographics | Rating | Rank | In Labor Force | Age > 16 |
| Immigrants | South Central Asia | 100.0 /100 | #35 | Exceptional 67.1% |
| Immigrants | Western Africa | 100.0 /100 | #36 | Exceptional 67.1% |
| Immigrants | Afghanistan | 100.0 /100 | #37 | Exceptional 67.0% |
| Immigrants | Nigeria | 100.0 /100 | #38 | Exceptional 66.9% |
| Salvadorans | 100.0 /100 | #39 | Exceptional 66.8% |
| Immigrants | El Salvador | 100.0 /100 | #40 | Exceptional 66.8% |
| Immigrants | Zimbabwe | 100.0 /100 | #41 | Exceptional 66.8% |
| Senegalese | 100.0 /100 | #42 | Exceptional 66.7% |
| Luxembourgers | 100.0 /100 | #43 | Exceptional 66.7% |
| Immigrants | Pakistan | 100.0 /100 | #44 | Exceptional 66.7% |
| Immigrants | Brazil | 100.0 /100 | #45 | Exceptional 66.7% |
| Brazilians | 100.0 /100 | #46 | Exceptional 66.6% |
| Immigrants | Bulgaria | 100.0 /100 | #47 | Exceptional 66.6% |
| Nigerians | 100.0 /100 | #48 | Exceptional 66.6% |
| Immigrants | Northern Africa | 100.0 /100 | #49 | Exceptional 66.6% |
Demographics Similar to Lebanese by In Labor Force | Age > 16
In terms of in labor force | age > 16, the demographic groups most similar to Lebanese are Immigrants from Hungary (64.5%, a difference of 0.010%), Immigrants from Bangladesh (64.5%, a difference of 0.030%), Immigrants from Dominica (64.5%, a difference of 0.030%), Immigrants from Netherlands (64.5%, a difference of 0.040%), and Vietnamese (64.6%, a difference of 0.050%).
| Demographics | Rating | Rank | In Labor Force | Age > 16 |
| Immigrants | Northern Europe | 7.2 /100 | #231 | Tragic 64.7% |
| Africans | 5.8 /100 | #232 | Tragic 64.6% |
| Slavs | 4.9 /100 | #233 | Tragic 64.6% |
| Vietnamese | 4.7 /100 | #234 | Tragic 64.6% |
| Austrians | 4.6 /100 | #235 | Tragic 64.6% |
| Immigrants | Norway | 4.6 /100 | #236 | Tragic 64.6% |
| Italians | 4.6 /100 | #237 | Tragic 64.6% |
| Lebanese | 3.9 /100 | #238 | Tragic 64.5% |
| Immigrants | Hungary | 3.8 /100 | #239 | Tragic 64.5% |
| Immigrants | Bangladesh | 3.6 /100 | #240 | Tragic 64.5% |
| Immigrants | Dominica | 3.5 /100 | #241 | Tragic 64.5% |
| Immigrants | Netherlands | 3.4 /100 | #242 | Tragic 64.5% |
| Immigrants | Lebanon | 3.2 /100 | #243 | Tragic 64.5% |
| Tsimshian | 3.1 /100 | #244 | Tragic 64.5% |
| West Indians | 3.0 /100 | #245 | Tragic 64.5% |